Hiya Inc. (Corporate Sponsorship)
Hiya Connect
Improve the usability of a B2B analytics dashboard that helps call centers enhance their branding, security, and overall performance through data-driven insights.
My Role
Evaluative Research
Usability Research
UX Design
Timeline
Jan - Mar 2024
10 weeks
Skills
Figma, Adobe Illustrator, Userinterviews
Team
3 Designers
2 Researchers
My Contributions
As a UX researcher and designer working with Hiya Inc., I collaborated with a cross-functional team of senior UX researchers, product designers, and product managers. Our goal was to craft and execute a comprehensive usability study for their newly launched analytics platform. Working under a tight deadline, we aimed to deliver actionable insights that could be swiftly implemented. My contributions helped shape key improvements to the platform, while enhancing my own usability testing skills.
Heuristic Evaluation
I contributed to the heuristic evaluation of Hiya Connect using Nielsen Norman's 10 Usability Heuristics, providing context for our usability study.
Participant Recruiting
I collaborated on refining participant screening criteria and helped recruit target call center employees through userinterviews.com.
Usability Test Facilitator
I conducted pilot tests and facilitated cognitive walkthroughs, interviewing and documenting sessions through note-taking and transcribing.
Affinitizing Key Findings
I heavily supported the team in data analysis, contributing to the affinity diagram discussions and translating findings into recommendations.
Usability Study Final Report
I led in the design and layout of the Executive Presentation Slide Deck and helped craft the Final Usability Study Report tailored to diverse stakeholders.


Unable to delete a phone number
Inactive “cancel” button
Lack of information on graph type
Users don’t have the option to select a customized timeframe when viewing phone calls
Navigating to a separate “Phone Numbers” tab
Lack of error messages.


Executive Presentation at Hiya Inc.
I served as a lead presenter, delivering our findings and addressing questions during the executive presentation to senior representatives of the product, design, and engineering teams at Hiya Inc.
Overview
What is Hiya Inc.?
Hiya Inc. is a Seattle-based B2B startup that offers two key services: spam and fraud call protection, and call analytics. Their services include Hiya Connect for businesses, the Hiya app for consumers, and Hiya Protect for carriers and app developers. These solutions serve over 450 million users globally, enhancing telecommunications security and performance.

Hiya Connect
B2B call analytics website dashboard

Hiya Protect
Spam protection system for carriers and app developers

Hiya App
Call detection & management for consumers.
Problem
(Jan 2024) Hiya Inc. launched a complete redesign of Hiya Connect, their call analytics dashboard. This new platform required rigorous evaluation before wide-scale deployment to ensure it effectively boosted productivity for its target users: senior-level call center managers tasked with tracking and analyzing call performance.
Opportunity
We conducted a comprehensive usability study on the account performance analytics page, the platform's core feature. Our research identified key friction points in reporting, data visualization, and navigation. We developed actionable findings for immediate implementation.
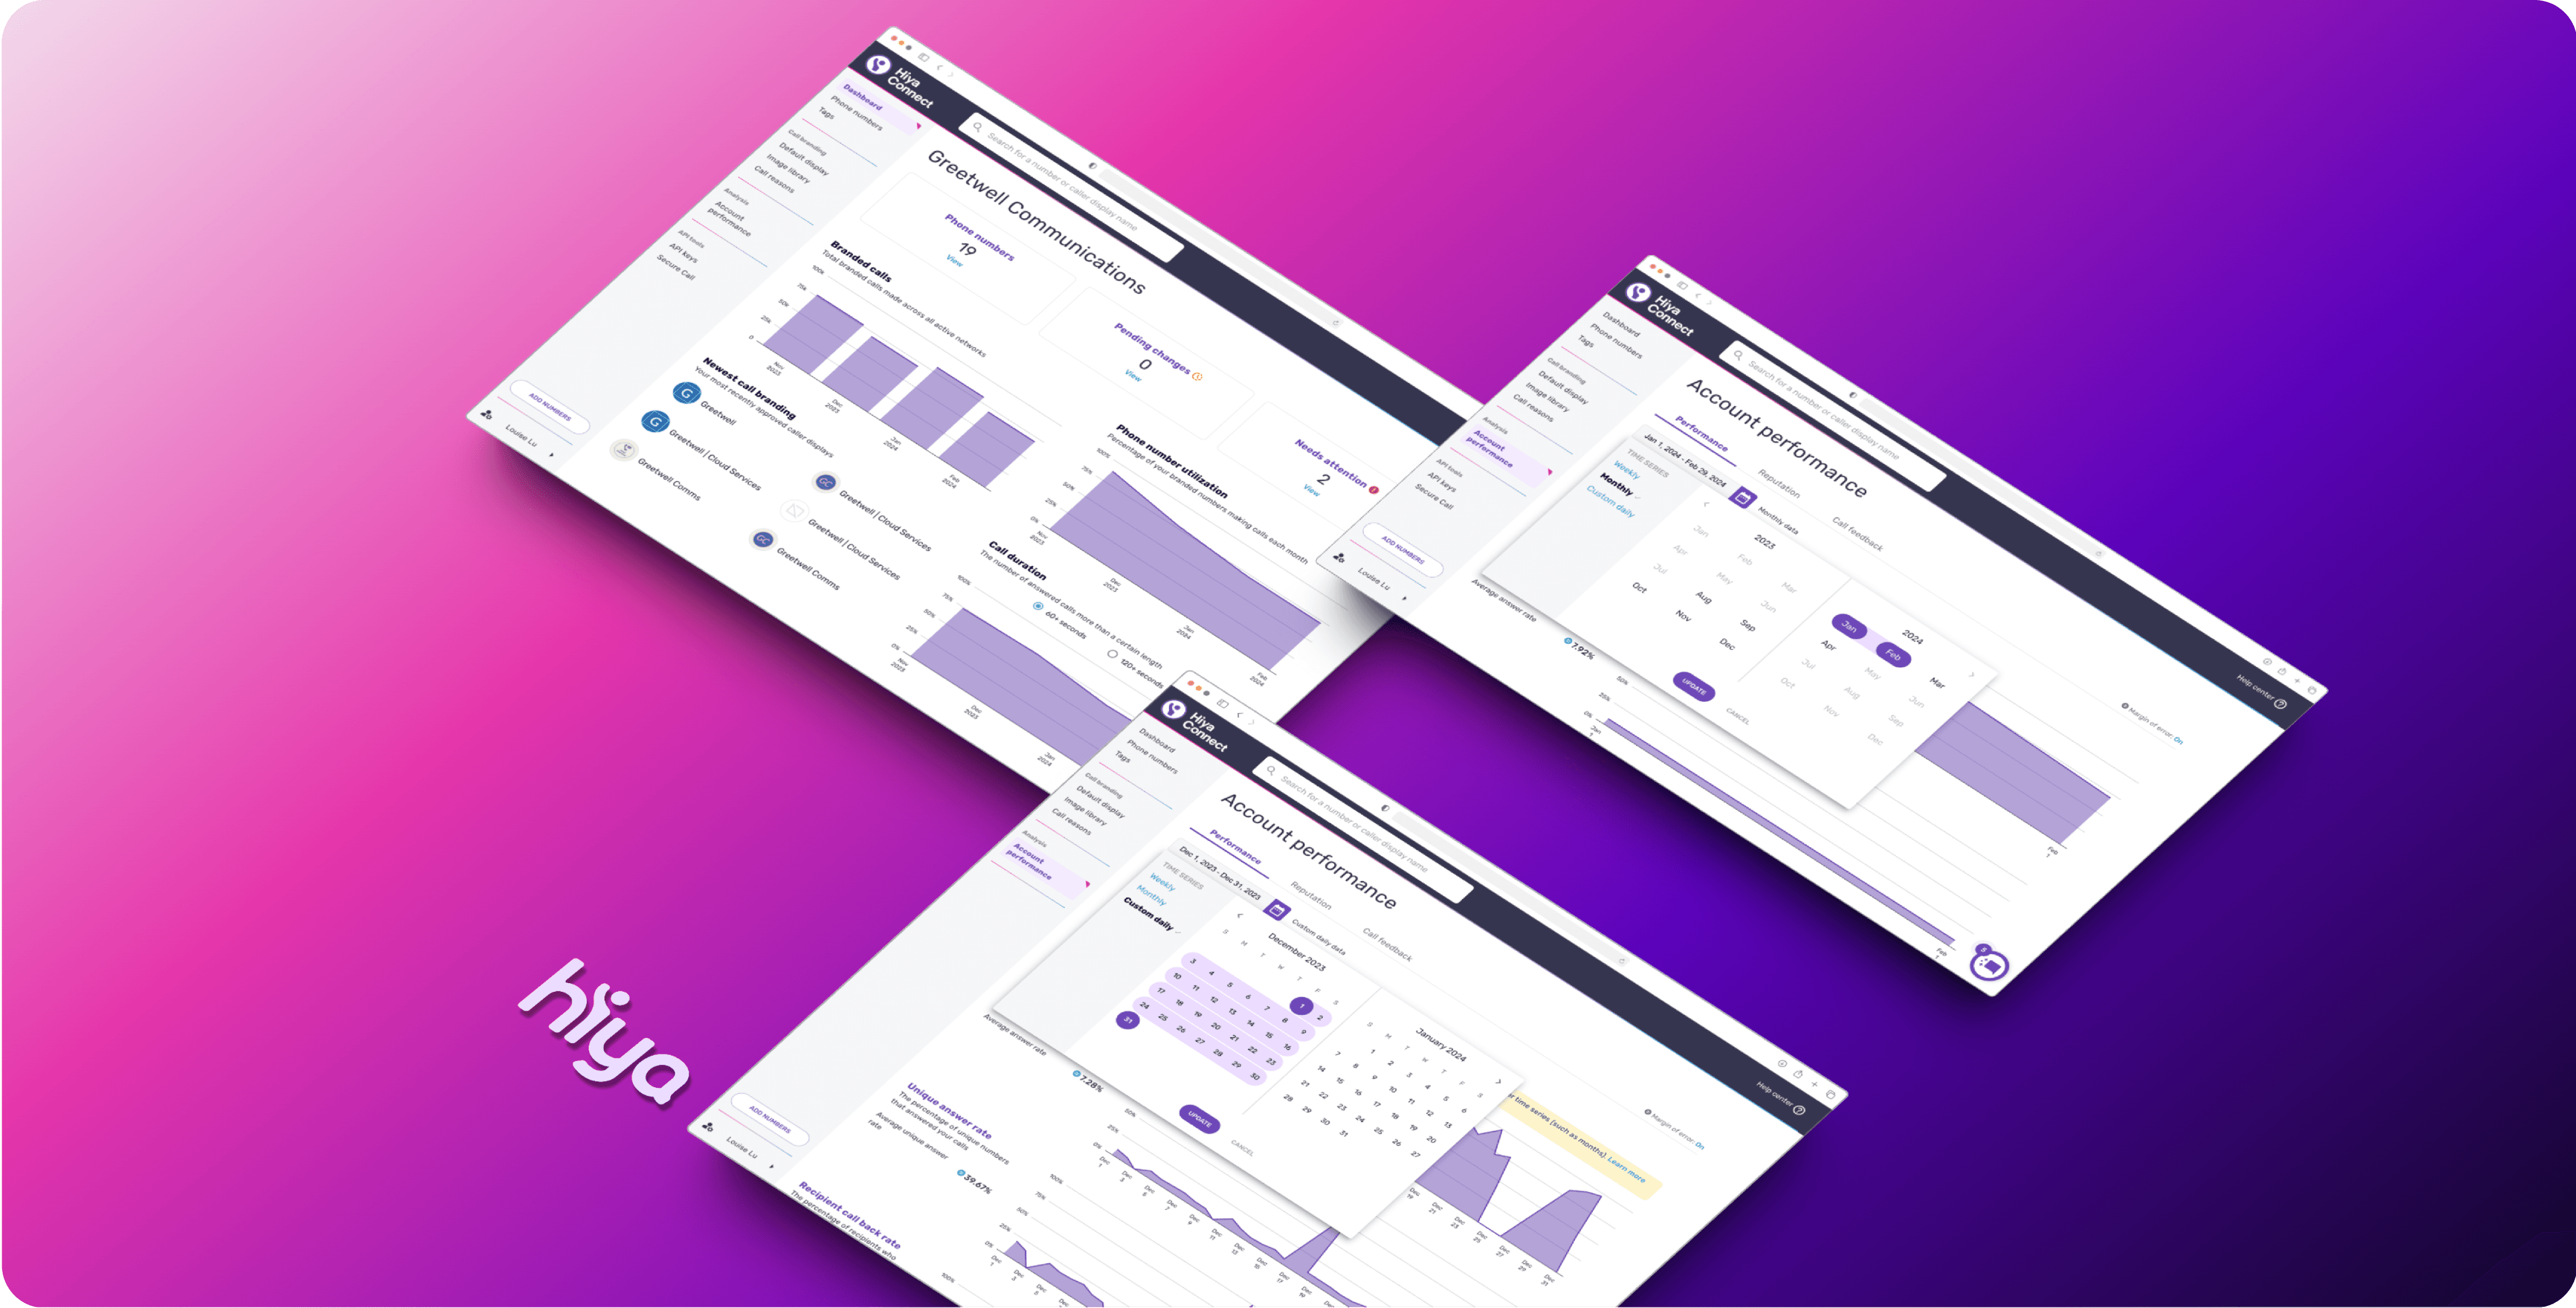
Hiya Connect's Account Performance Dashboard
Impact
Our usability study's key recommendations were implemented and launched on Hiya Connect within weeks of our executive presentation, significantly enhancing the platform's user experience and functionality.
Finding: Users desire greater data visualization options & improved copywriting to contextualize graph content.
Users requested enhanced data visualizations and clearer graph explanations. They sought additional graphs to contextualize existing broad visualizations.
Recommendation: Introduce descriptive titles, interactive features, and diverse graph types
Implement clearer graph titles, interactive elements, and more specific, detailed graphs, allowing users to personalize and contextualize data views.
Result: Implement additional graphs & data features
Before
After: Updated Dashboard
2 Additional Graphs


New Toggle Features
Descriptive Titles
Heuristic Evaluation
Dashboard Investigation
We performed an internal investigation using Nielsen Norman's 10 Usability Heuristic guidelines on both the updated dashboard platform to understand the system's core purpose and target users, which helped us establish possible pain points in the current user experience to usability test.
Initial Research Questions
Do people understand how to interpret data visualizations?
Can people navigate the platform in order to run a report for a specific time frame and interval (weekly, monthly, etc)?
Do people understand the messaging for low call volume?
Do people understand how margin of error should impact the confidence in their decisions?
Identified Usability Issues
01
02
Low Call Volume Banner is not easily visible and the copy can be misleading when graphs often appear to have little to no change.
Influenced by Nielsen Norman’s “Visibility of System Status” (01) and “Aesthetic Design” (08) principles.
Graph titles and data points lack appropriate context for its purpose, increasing cognitive load.
Influenced by Nielsen Norman’s “Recognitive Rather than Recall” (06) principle.
03
04
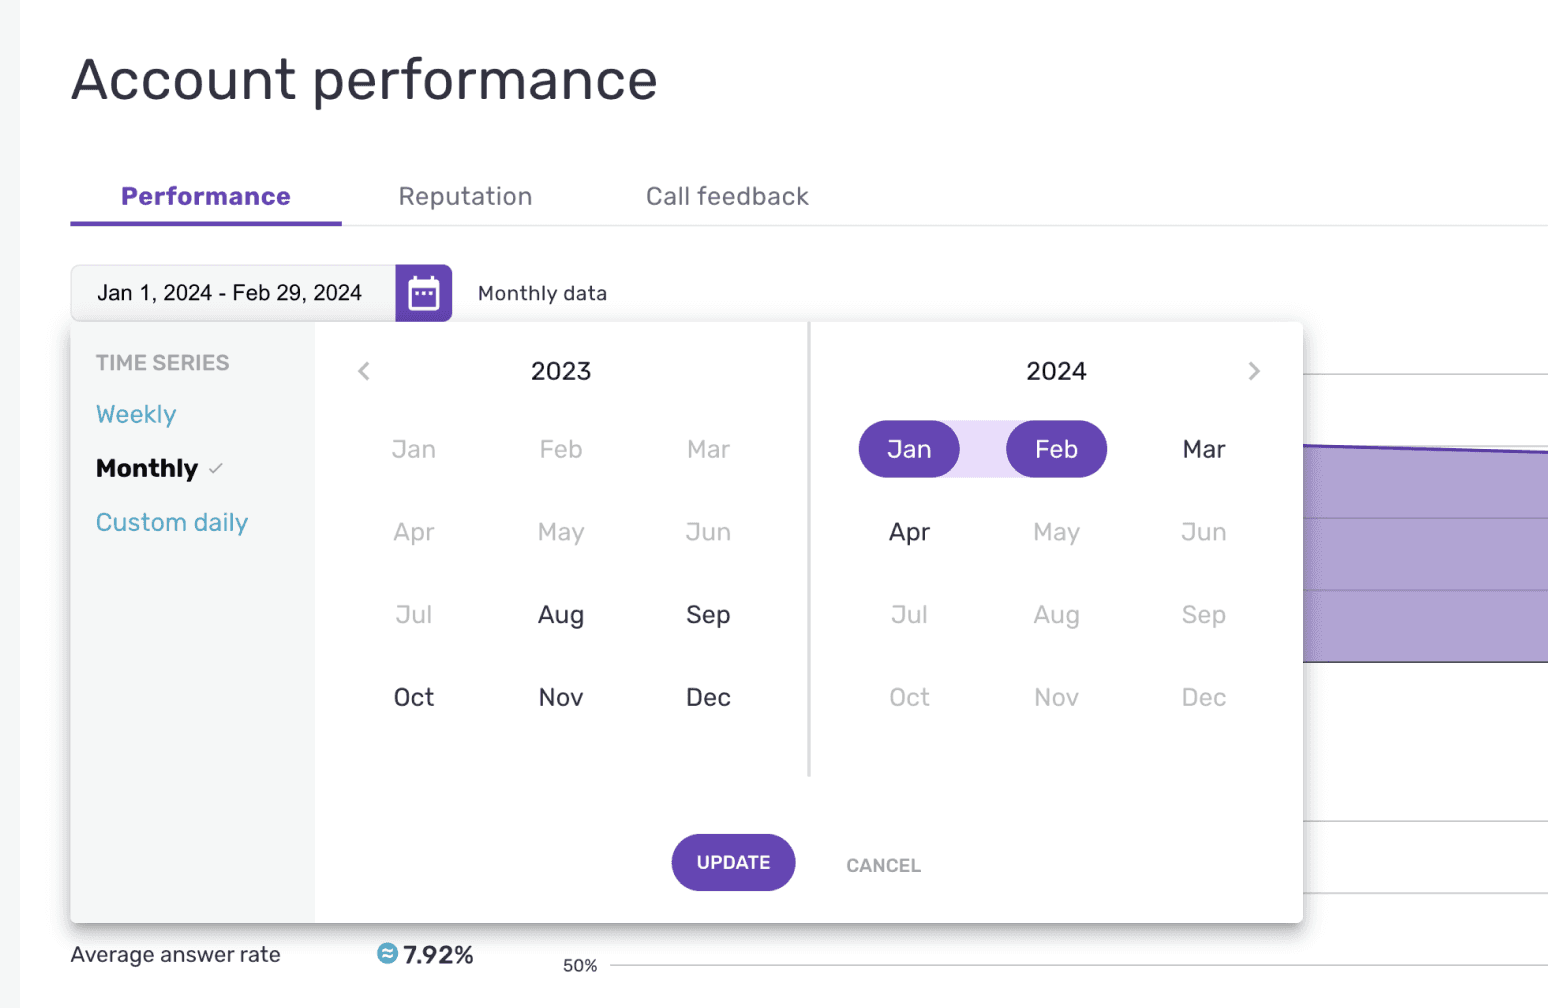
Date Picker options between weekly, monthly, and custom time lack clarity and intuitive use.
Influenced by Nielsen Norman’s “User Control and Freedom” (03) and “Flexibility and Efficiency of Use” (07) principles.
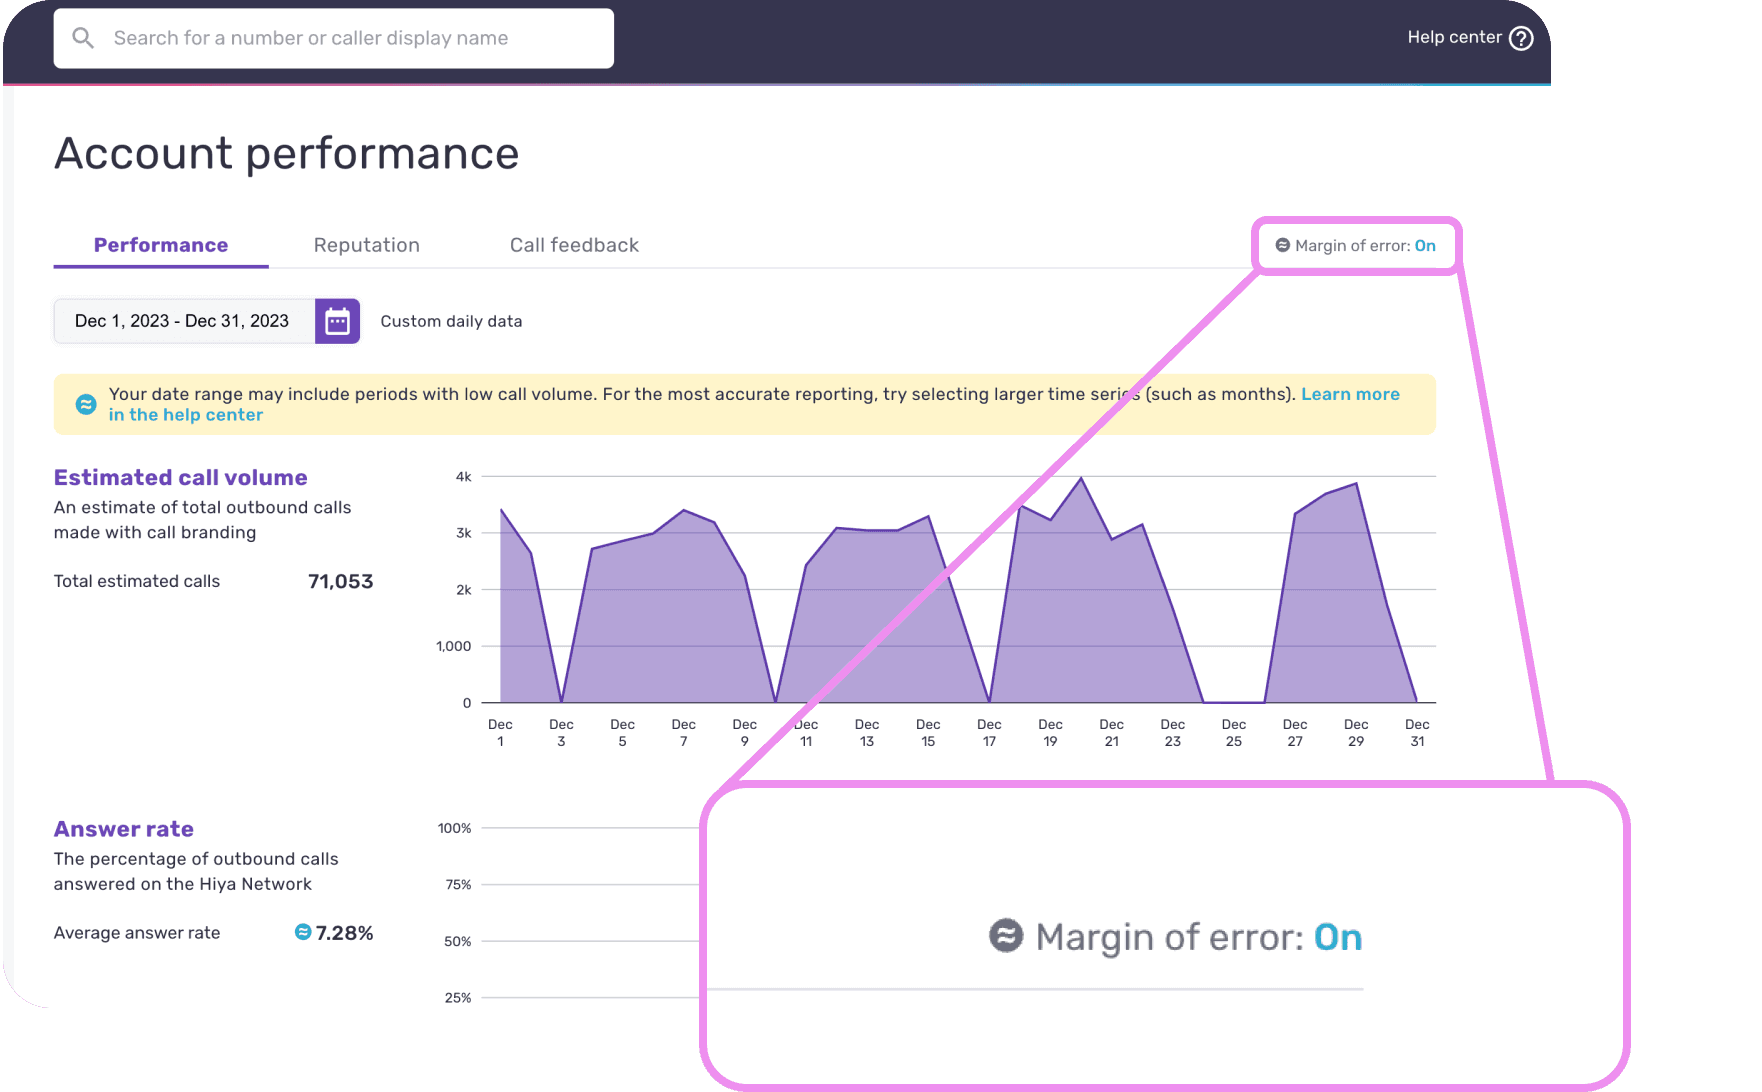
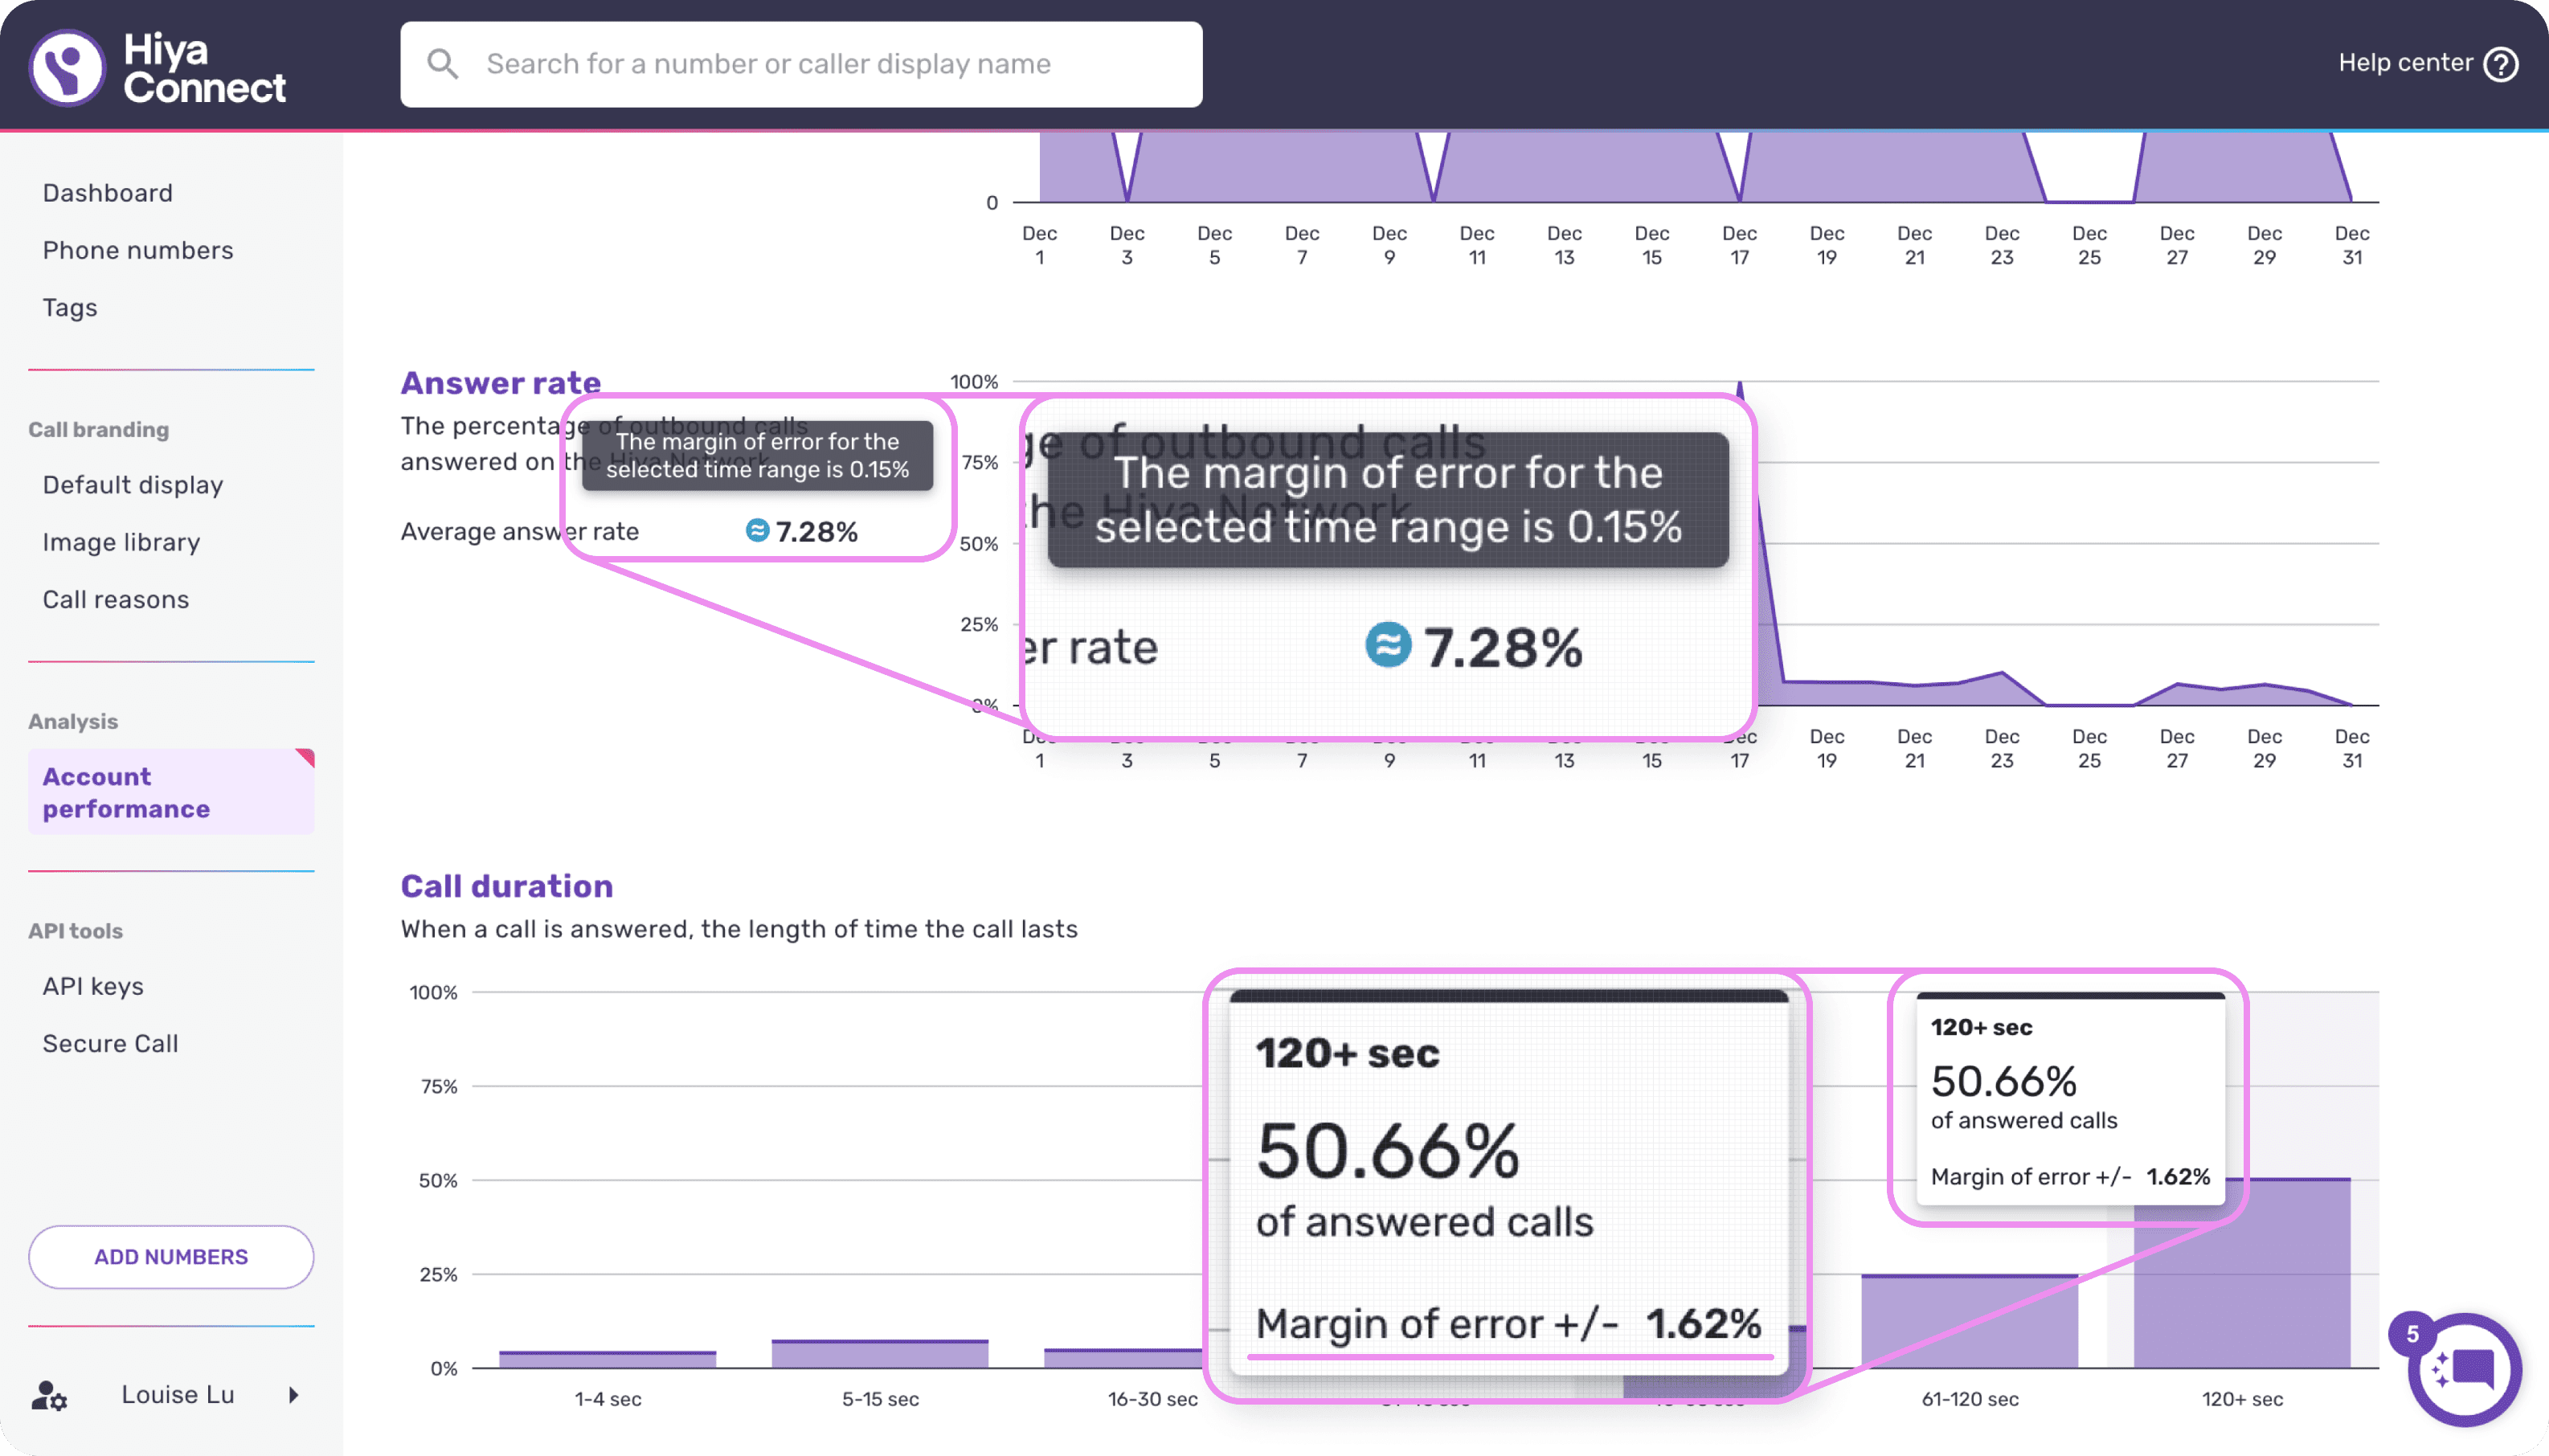
Margin of Error toggle not prominently displayed on dashboard, possibly reducing frequency of necessary use.
Influenced by Nielsen Norman’s “Visibility of System Status” (01) principle.
Participant Profile for Senior Level Call Center Employees
By exploring the internal dashboard and collaborating with Hiya's Sr. UX Researcher, we defined our usability study participant’s key traits. This shaped our screener criteria for the study, where we focused on finding US-based, English-speaking participants with relevant experience.
We used userinterviews.com to recruit our 5 participants who satisfied all our primary and secondary attributes.
Primary Attributes:
21 years+
English-speaking
US-based
Bachelor’s level eduation
6+ months of work experience at a call center
No prior experience with Hiya Connect
Secondary Attributes:
Manager or Director level position
Work full-time or temporarily unemployed
Experience working in a B2B environment
Familiarity with data analytics tools
Usability Study
Cognitive Walkthrough
We determined that an hour long cognitive walkthrough (n=5) would be the most effective method for testing the dashboard's full usability. This approach will reveal users' thought processes during task completion, allowing us to define tasks clearly, understand user expectations, and pinpoint gaps between design and user’s existing mental models.
3 Test Scenarios
Scenario A: Date Picker & Graph Interpretation
Participants navigated through Hiya Connect’s Account Performance page, run a monthly report, and interpret each graph metric presented.
Purpose: To evaluate the intuitiveness of the date picker for selecting time periods and assess comprehension of each graph type.

Scenario B: Low Call Volume
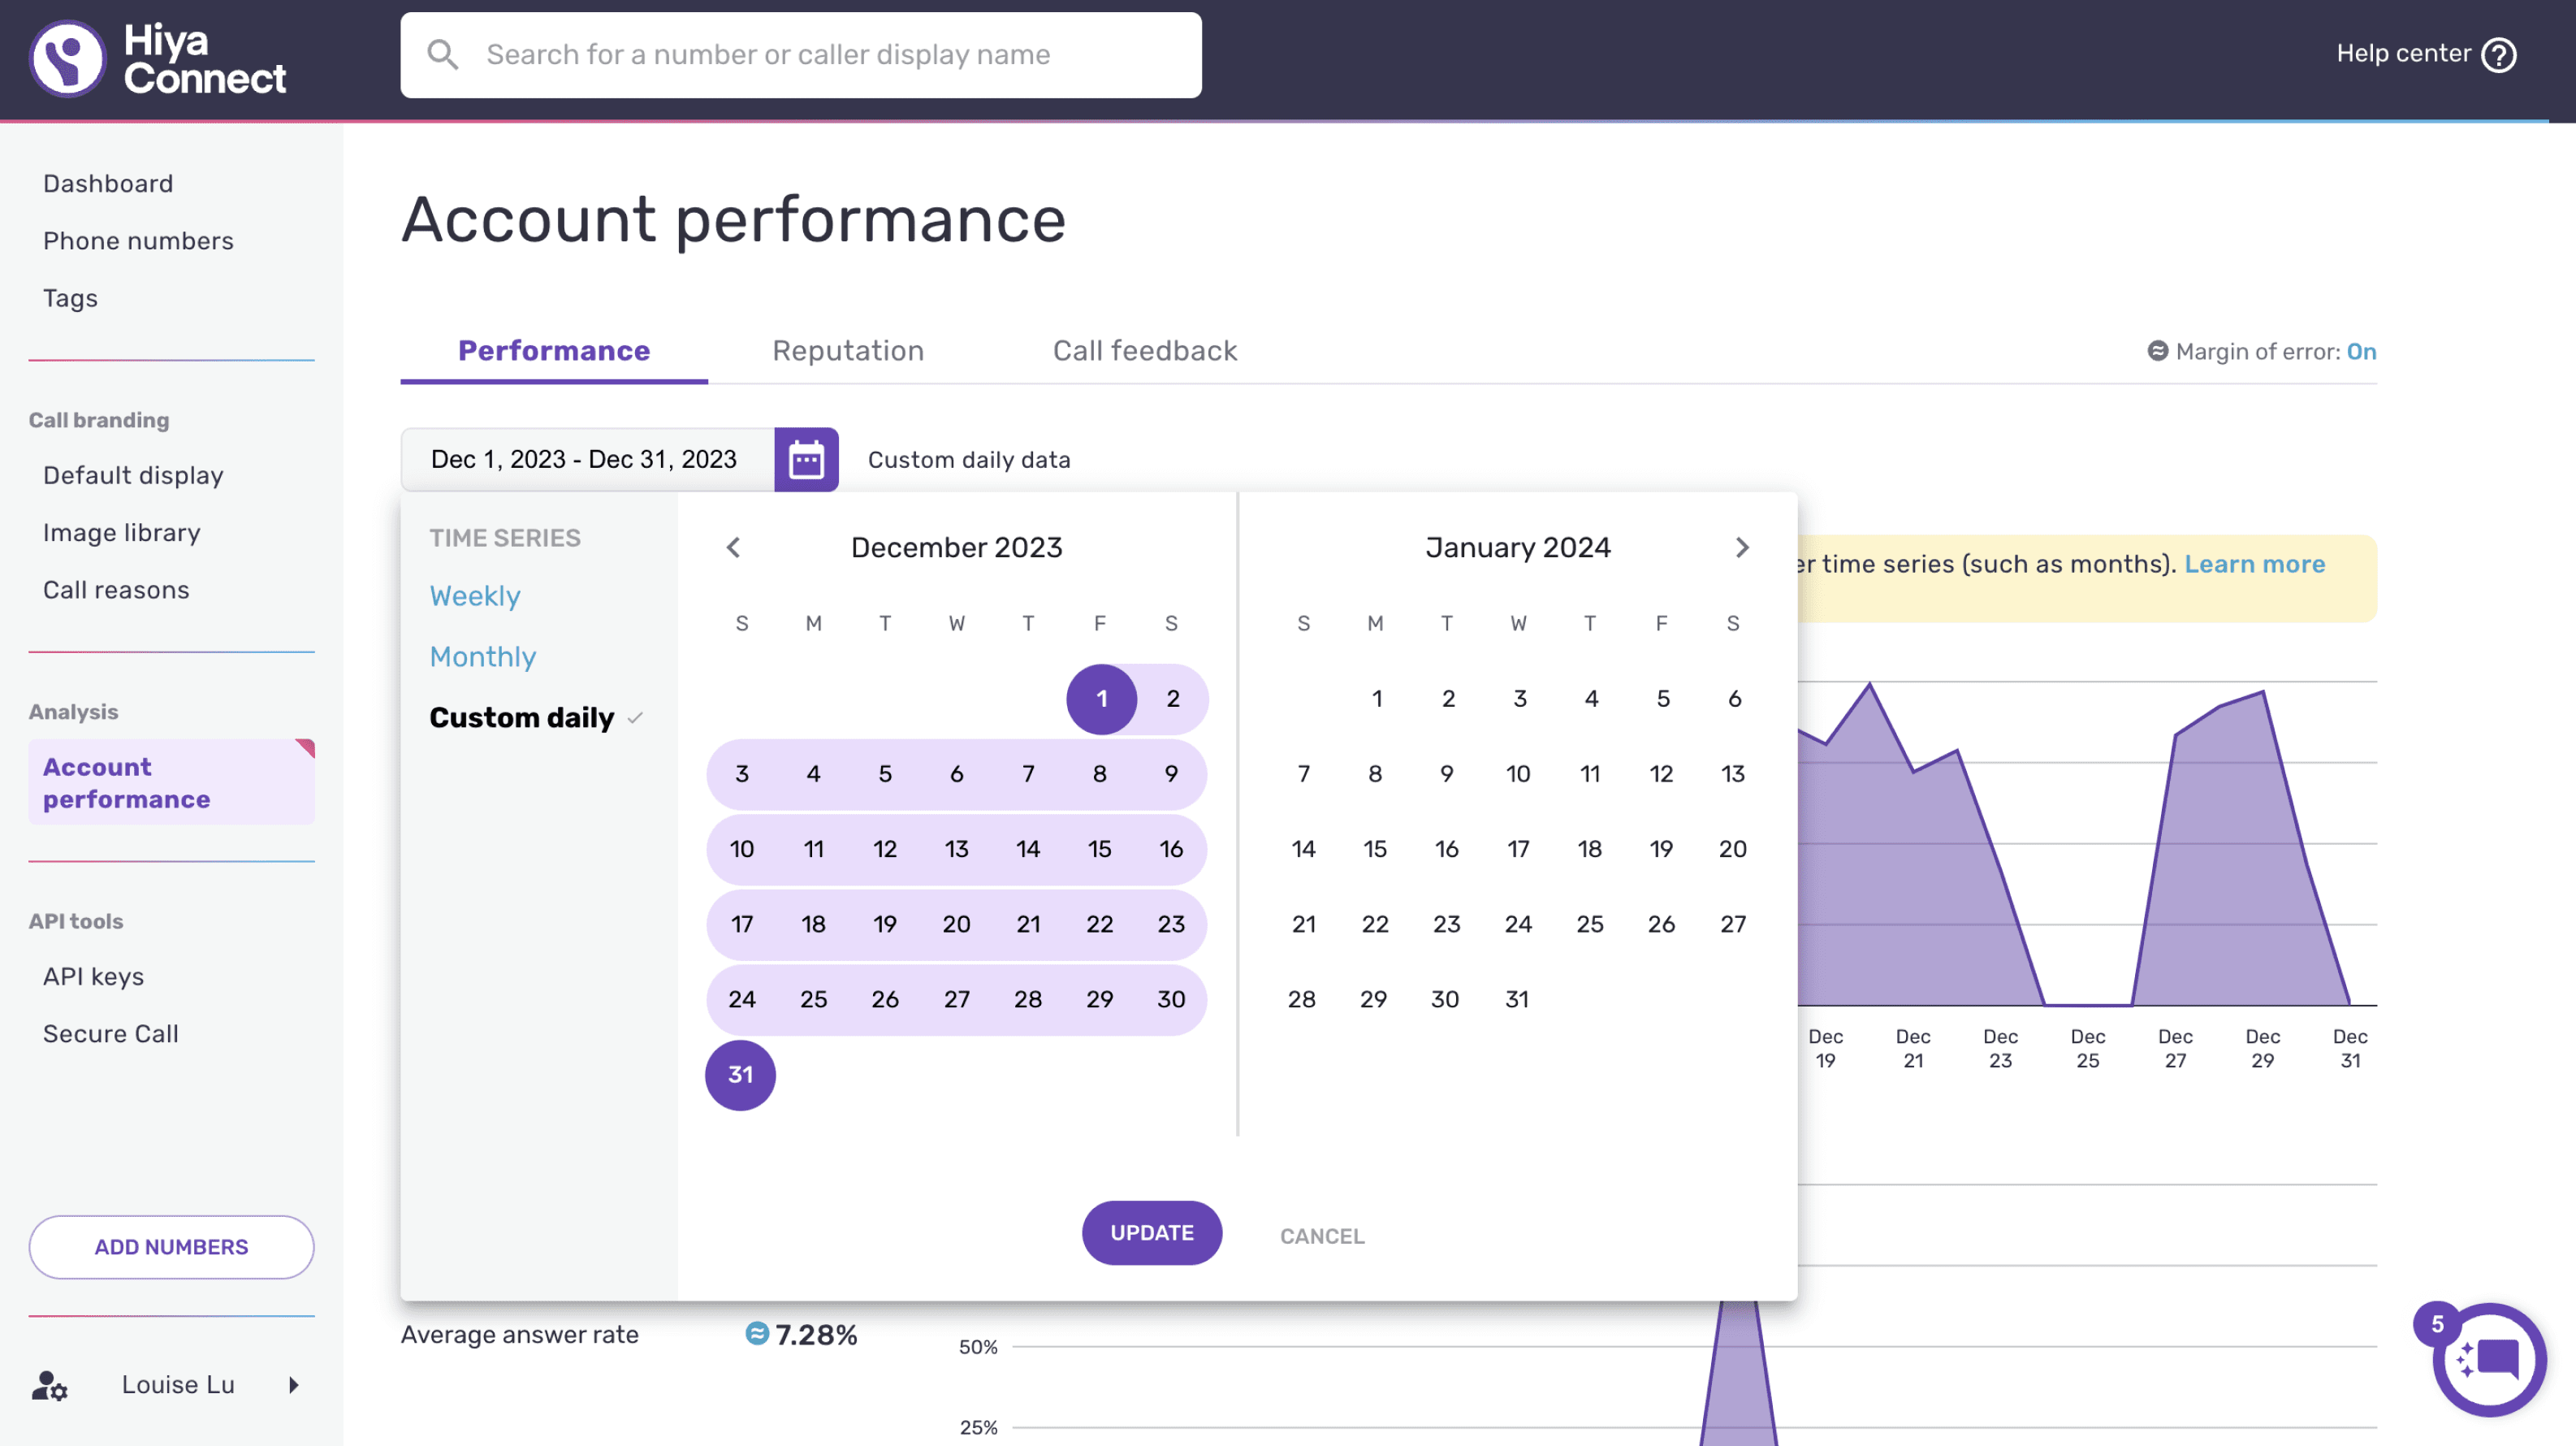
Participants generated a custom daily report for a one-month period and interpret the resulting graphs with the low call volume banner present.
Purpose: To evaluate if participants notice the Low Call Volume banner indicating insufficient data, understand its meaning, and recognize the need to adjust the date range to resolve the issue.
Scenario C: Margin of Error
Participants located and activated the margin of error feature, then explained its purpose and impact on graph data interpretation.
Purpose: To examine the discoverability of the margin of error feature and evaluate how it influences participants' interpretations of the graph data.
Crafting a Study Script to Measure Task Success Rates
We developed a step-by-step task breakdown for each scenario to effectively measure success rates, along with a detailed moderator script to guide participants. We also included wrap-up questions that involved a Likert scale questionnaire to gauge overall dashboard impressions.
Scenario B: Low Call Volume
Generate a custom daily report for a period with insufficient call volume, review and interpret the graphs while encountering the Low Call Volume banner as well as turn on the Margin of Error toggle.
Task
Success Criteria
01
Run a custom daily report from December 1st to December 31st,
Participants are able to identify that this custom daily time period has low call volume

02
Notice Low Call Volume banner
Participants are able to discover and interpret low call volume message
03
Review each graph metric.
Participants are able to successfully interpret the graph metrics and draw conclusions from it

04
Discover Margin of Error (Moe) Toggle feature naturally.
Participants are able to locate and turn on Margin of Error toggle feature
05
Interpret Margin of Error toggle feature.
Participants are able to successfully interpret the graphs and corresponding data points with the MoE turned on.
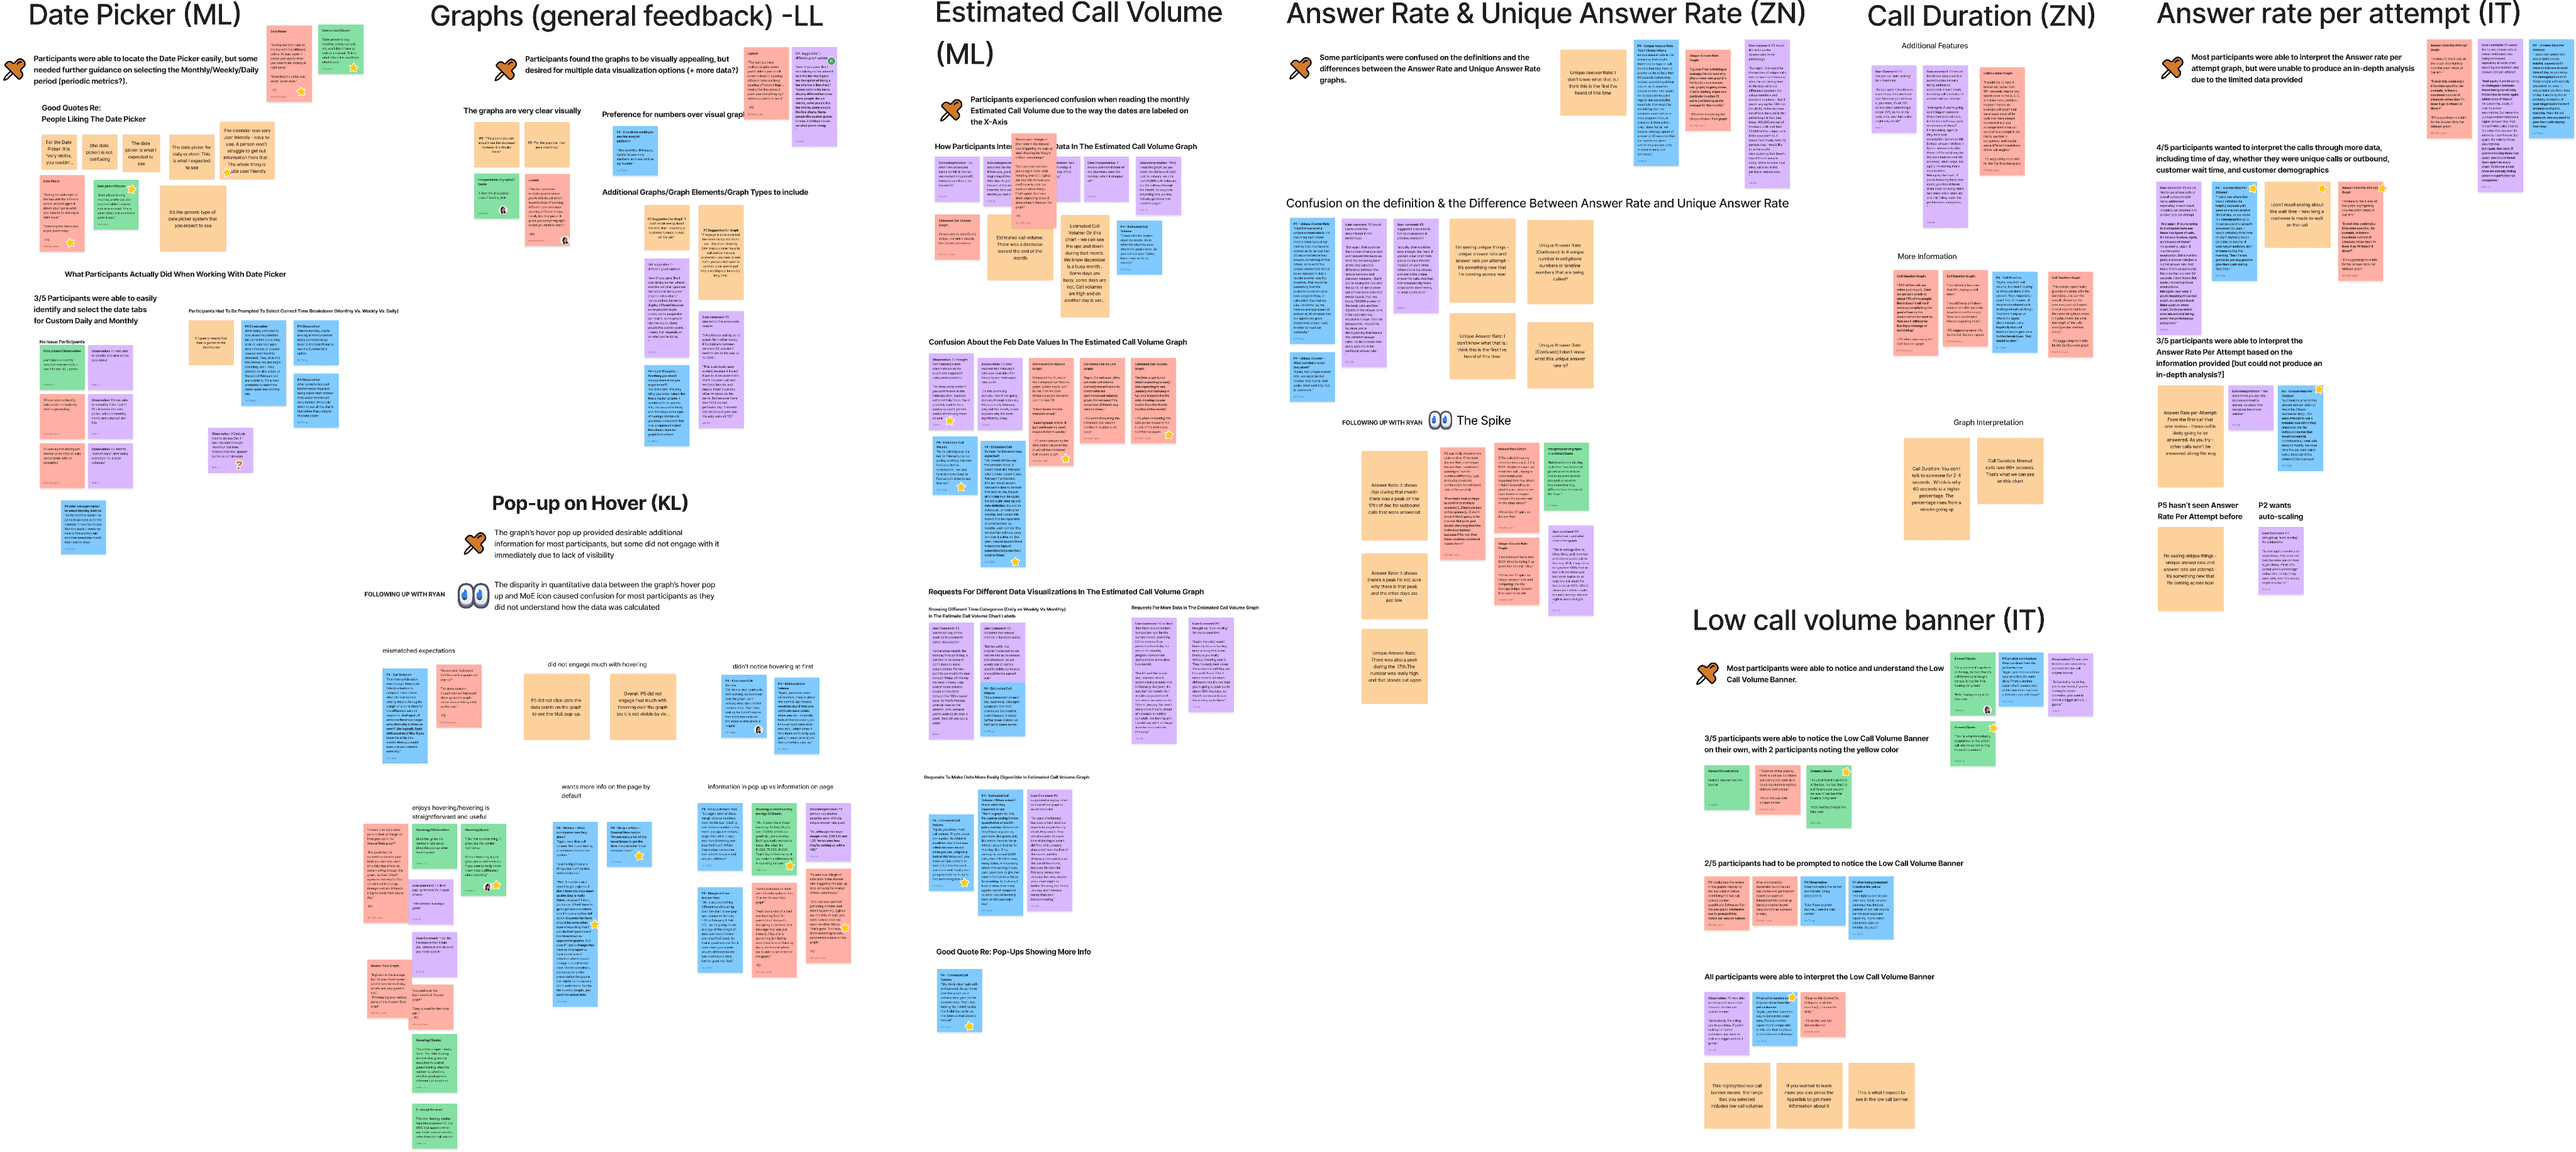
Synthesizing Feedback
Affinity Mapping
I processed the data from 2/5 participants, synthesizing their responses into key themes. These findings were then integrated into our team's affinity mapping process, revealing collective pain points and areas for dashboard improvement.

Initial Findings
Some participants could locate the date picker feature, but struggled to then select specific time periods (monthly, weekly, or custom daily).

Some participants had difficulty differentiating between certain graphs, expressing a need for more information to fully understand and conduct in-depth analysis of each metric type.

Overarching Themes
Most participants desired for more metadata and metrics to be added to the graphs so they could extract an in-depth analysis.
All participants appreciated the general design and visual appeal of Hiya Connect, but some noted that certain elements were not always easily identifiable (e.g. margin of error toggle and icon, information displayed on the graphs).
Some participants had questions regarding data transparency, such as more details about how Hiya is getting this data and how margin of error is being calculated.
Most participants want more features (e.g. data visualization options, autoscaling, exporting data) to enable them to customize their analyses and workflow.
Report Results
Findings & Recommendations
We prioritized findings based on implementation feasibility, highlighting both successful features and areas for improvement.
Ranking Definitions
High Priority
Prevent users from successfully completing identified tasks and should be addressed immediately.
Medium Priority
Involve adding more information features. These should be addressed after high priority items.
Low Priority
Minor usability problems do not affect the overall use of the analytics platform; address if time permits.
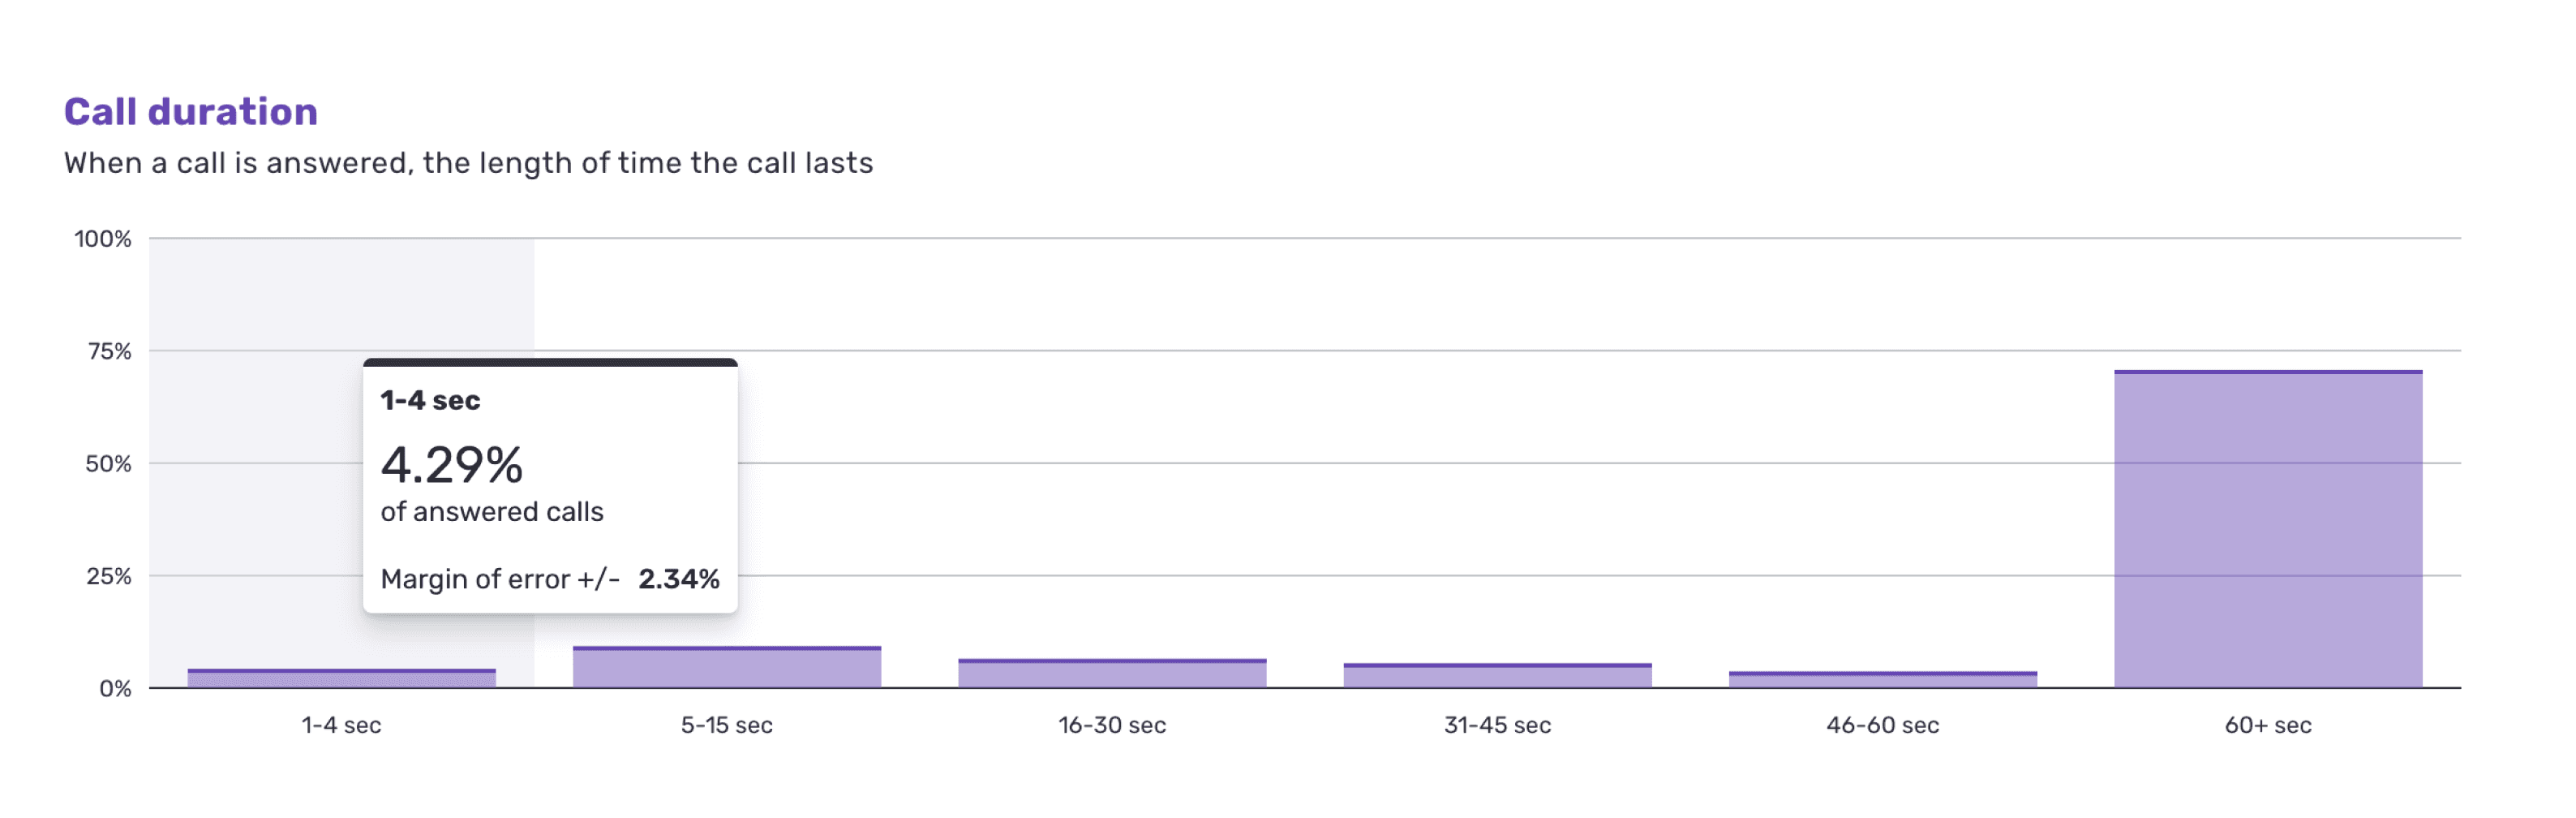
Finding 01
Participants question the Margin of Error feature because it appears in some graphs and not others.
3 out of 5 participants were confused by the inconsistent presence of the Margin of Error
“If I have Margin of Error for some and not always...it just causes more questions than gives answers.” P4
Recommendation
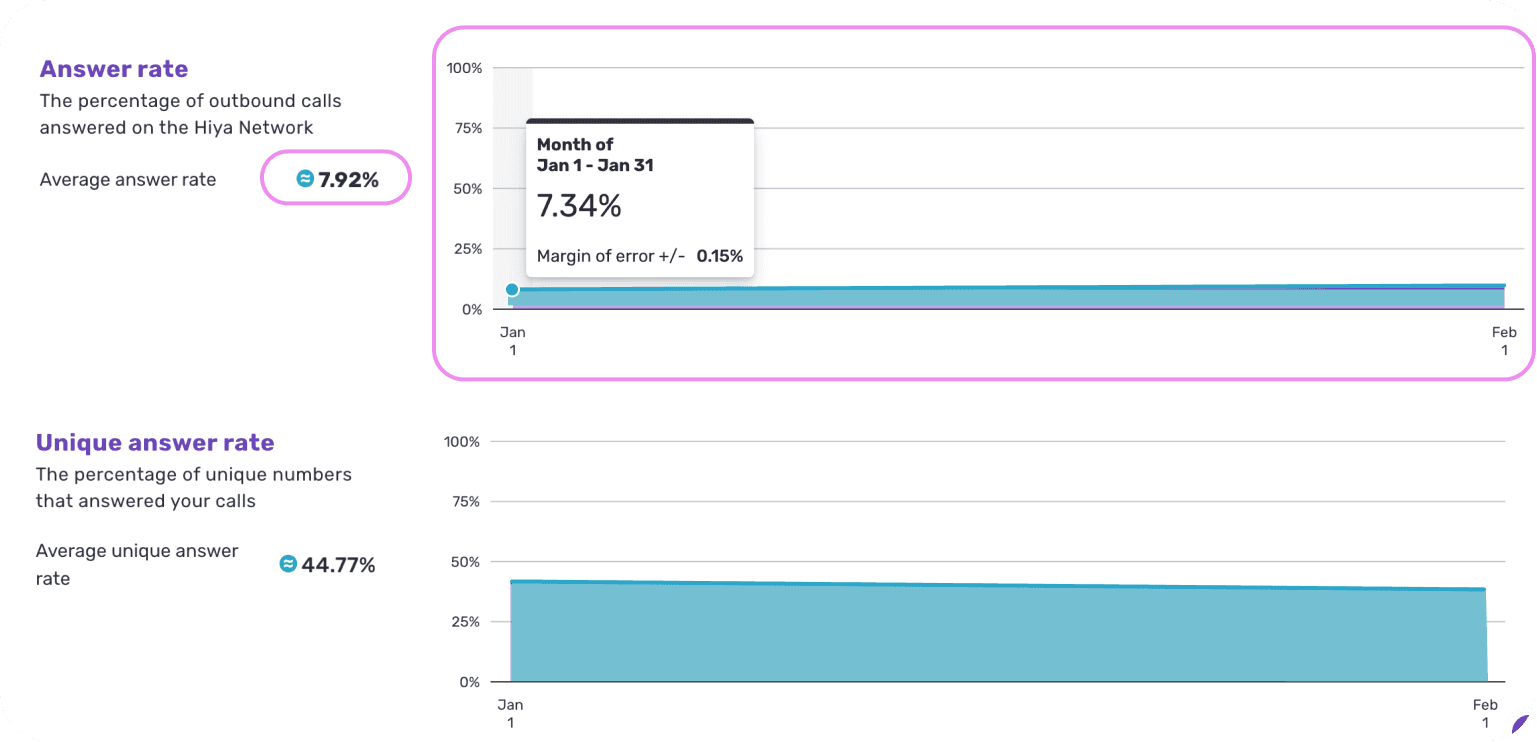
Enhance Margin of Error Visibility
Update graph colors to reflect the MoE icon when toggle is activated to showcase visible change.
Previous
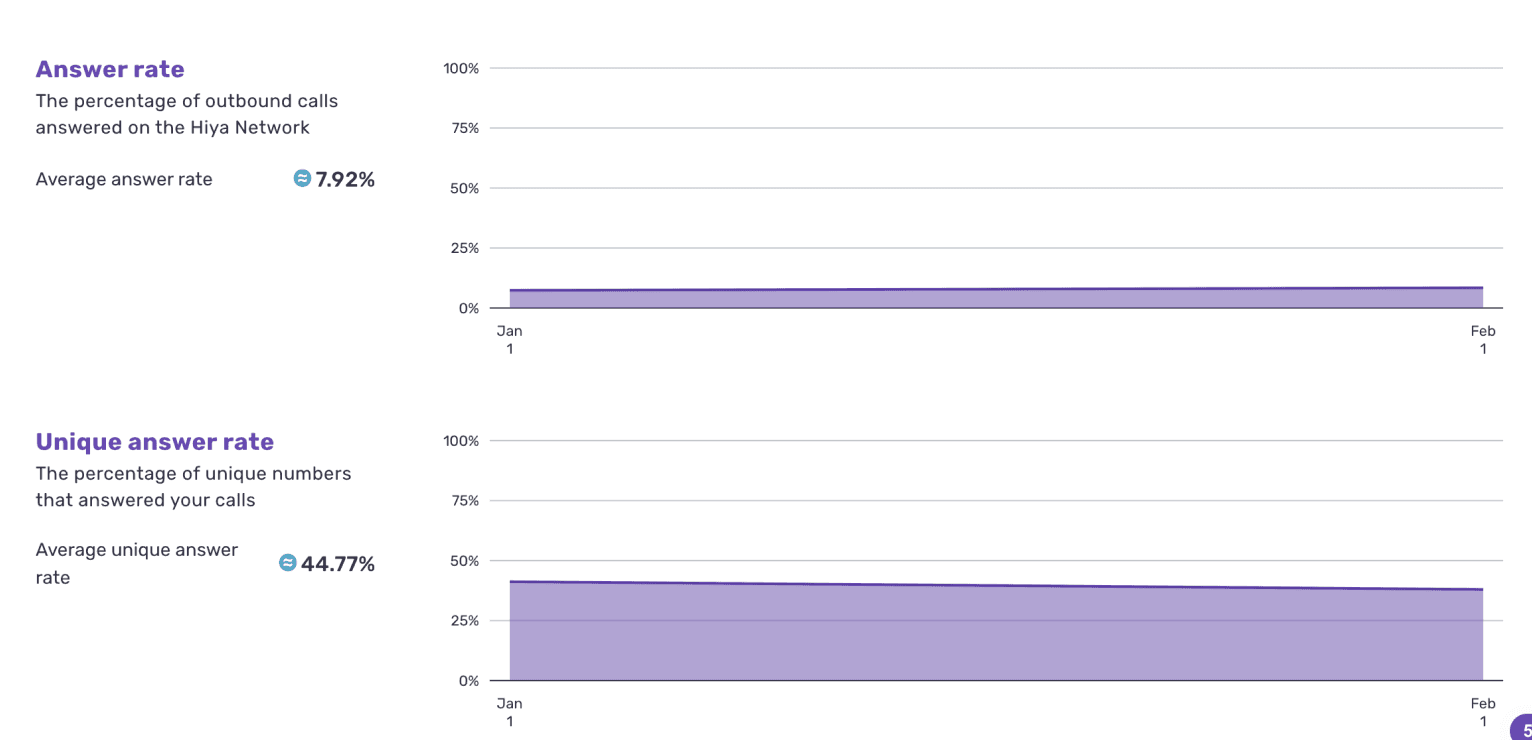
Updated
Add explanation under graphs without MoE, clarifying its absence for specific metrics.
Previous
Missing MoE
Updated
Exact count: No MoE applied

02
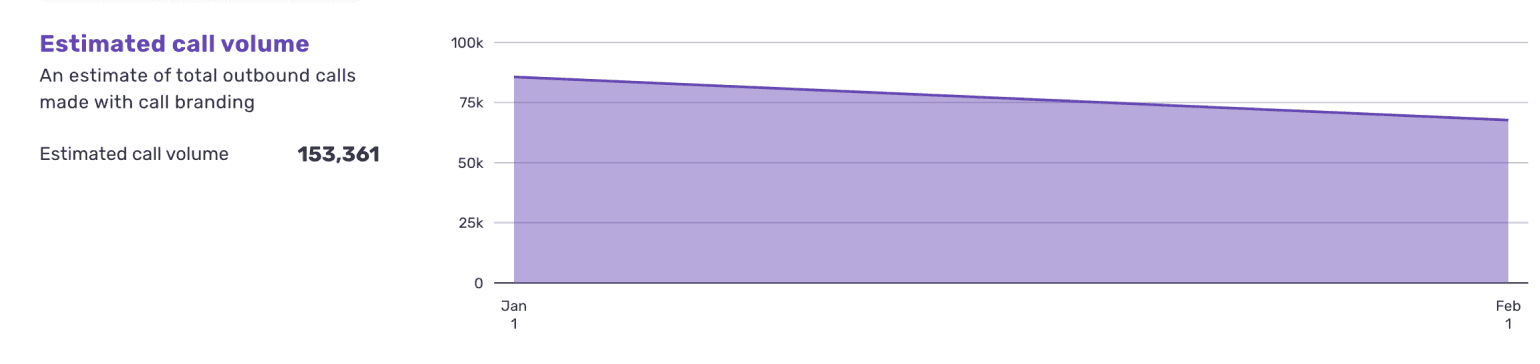
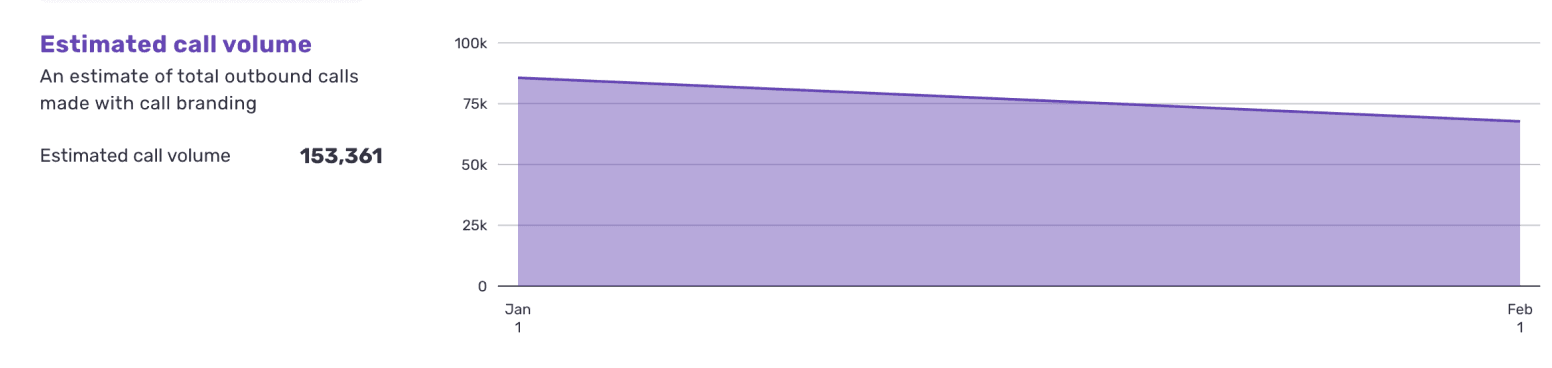
Some participants misinterpreted graphs because the x-axis labels were inconsistent and inaccurate, failing to correctly represent the selected time periods.
3 out of 5 participants stated that selecting “Monthly” in the date picker had pulled incomplete data for February because the Estimated Call Volume X-axis read “Jan 1 - Feb 1”.
“I was expecting to see January and February in full and it seems like it’s only showing me one month from the first to the first of the month.” P3
High Priority
Recommendation
Ensure the X-Axis Reflects the Selected Date Range
Align and incorporate more data points on the x-axis labels to accurately reflect the selected time period.
Previous

Updated

Finding 02
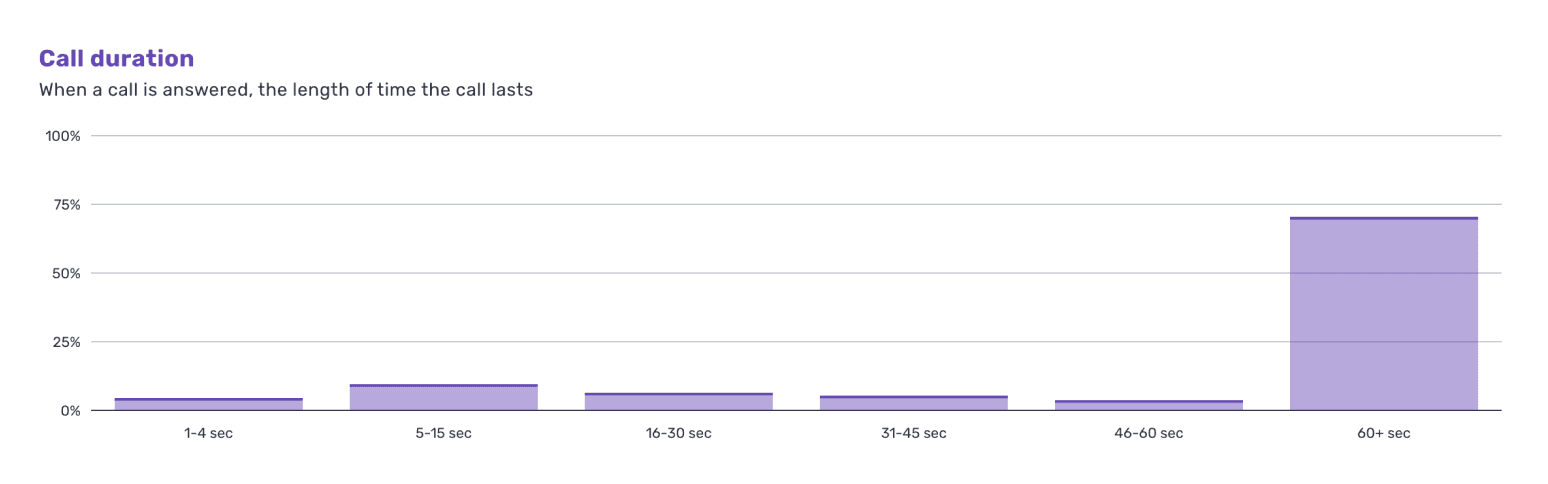
Participants wanted more data on the graphs and multiple data visualization options.
3 out of 5 participants wanted additional data visualization options beyond bar and line graphs, such as pie charts or scattergrams.
“...some people like pie charts, some people like bar charts, some people like line charts. Some people like scatter grams. I mean, it all depends on what you're doing.” P2
Recommendation
Enhance Margin of Error Visibility
Add a dropdown menu next to the graph’s informational section which allows participants to select different data visualization options.
Previous


Updated
Graph options
Select
Bar chart
Pie chart
Scattergram

Graph options
Select
Bar chart
Pie chart
Scattergram
Finding 03
Most participants were able to notice and understand the Low Call Volume Banner
3 out of 5 participants were able to notice the Low Call Volume Banner on their own.
“There is a yellow box there just saying that your date range may include periods with low call volume.” P3
All participants were able to interpret the Low Call Volume Banner.
“So basically, it's telling you to you know, if you're looking for better estimates, you want to look at a bigger picture.” P2
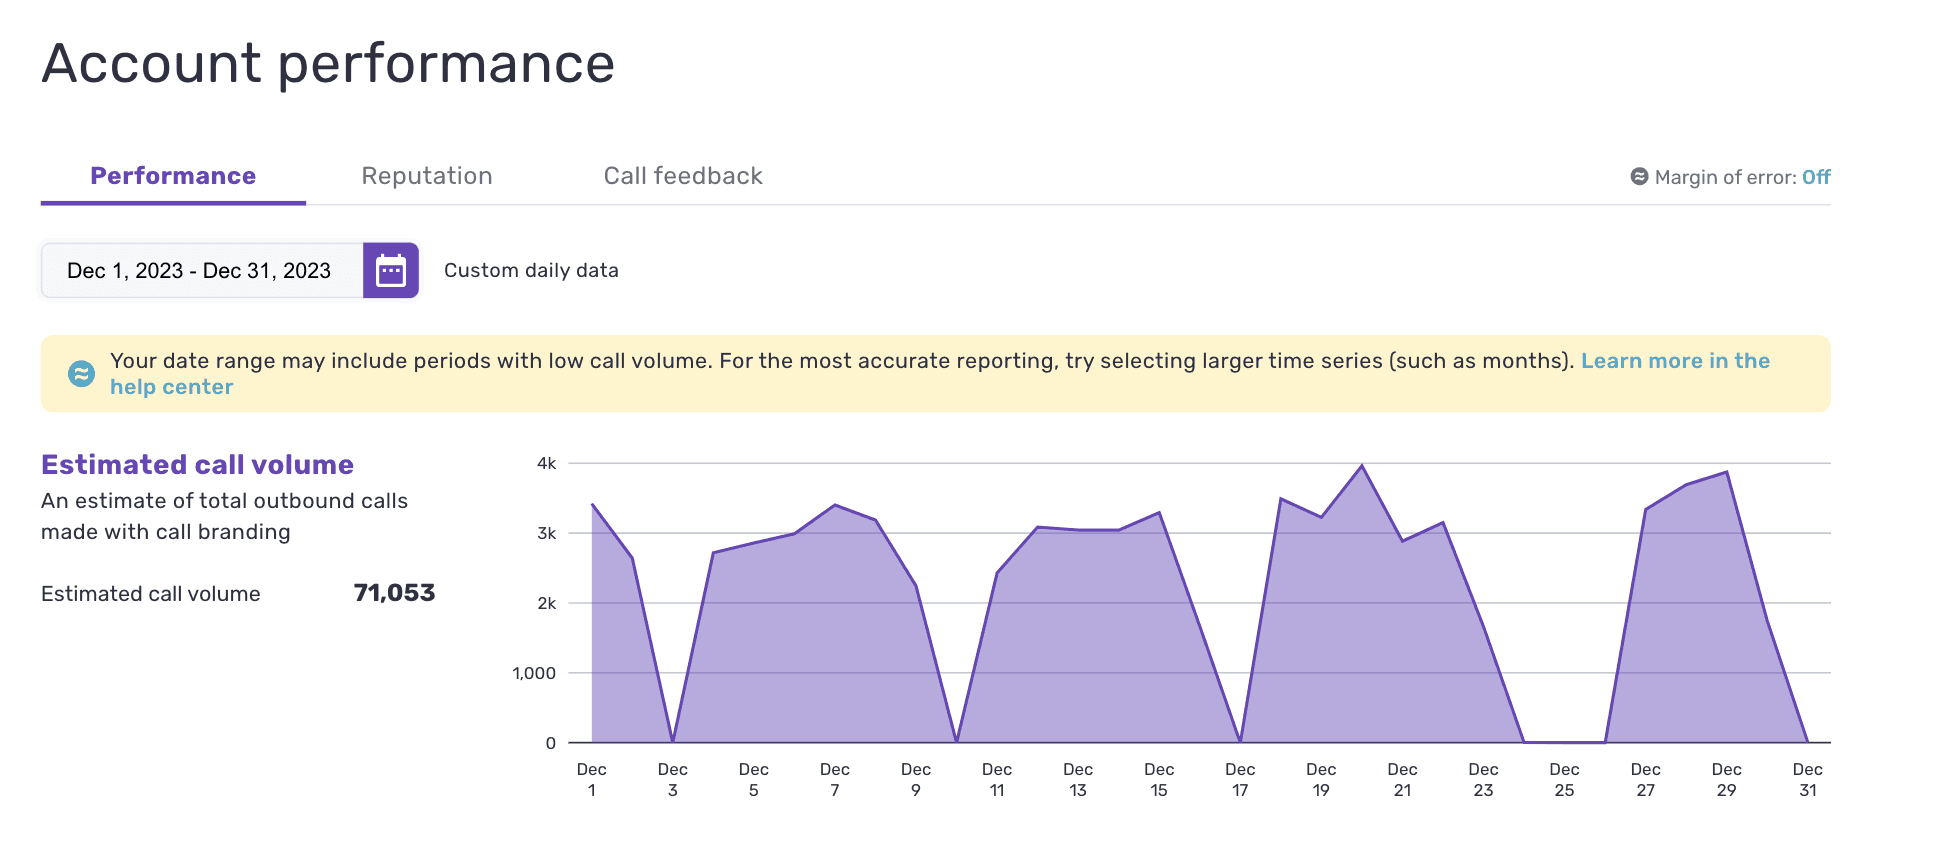
Low Call Volume Banner
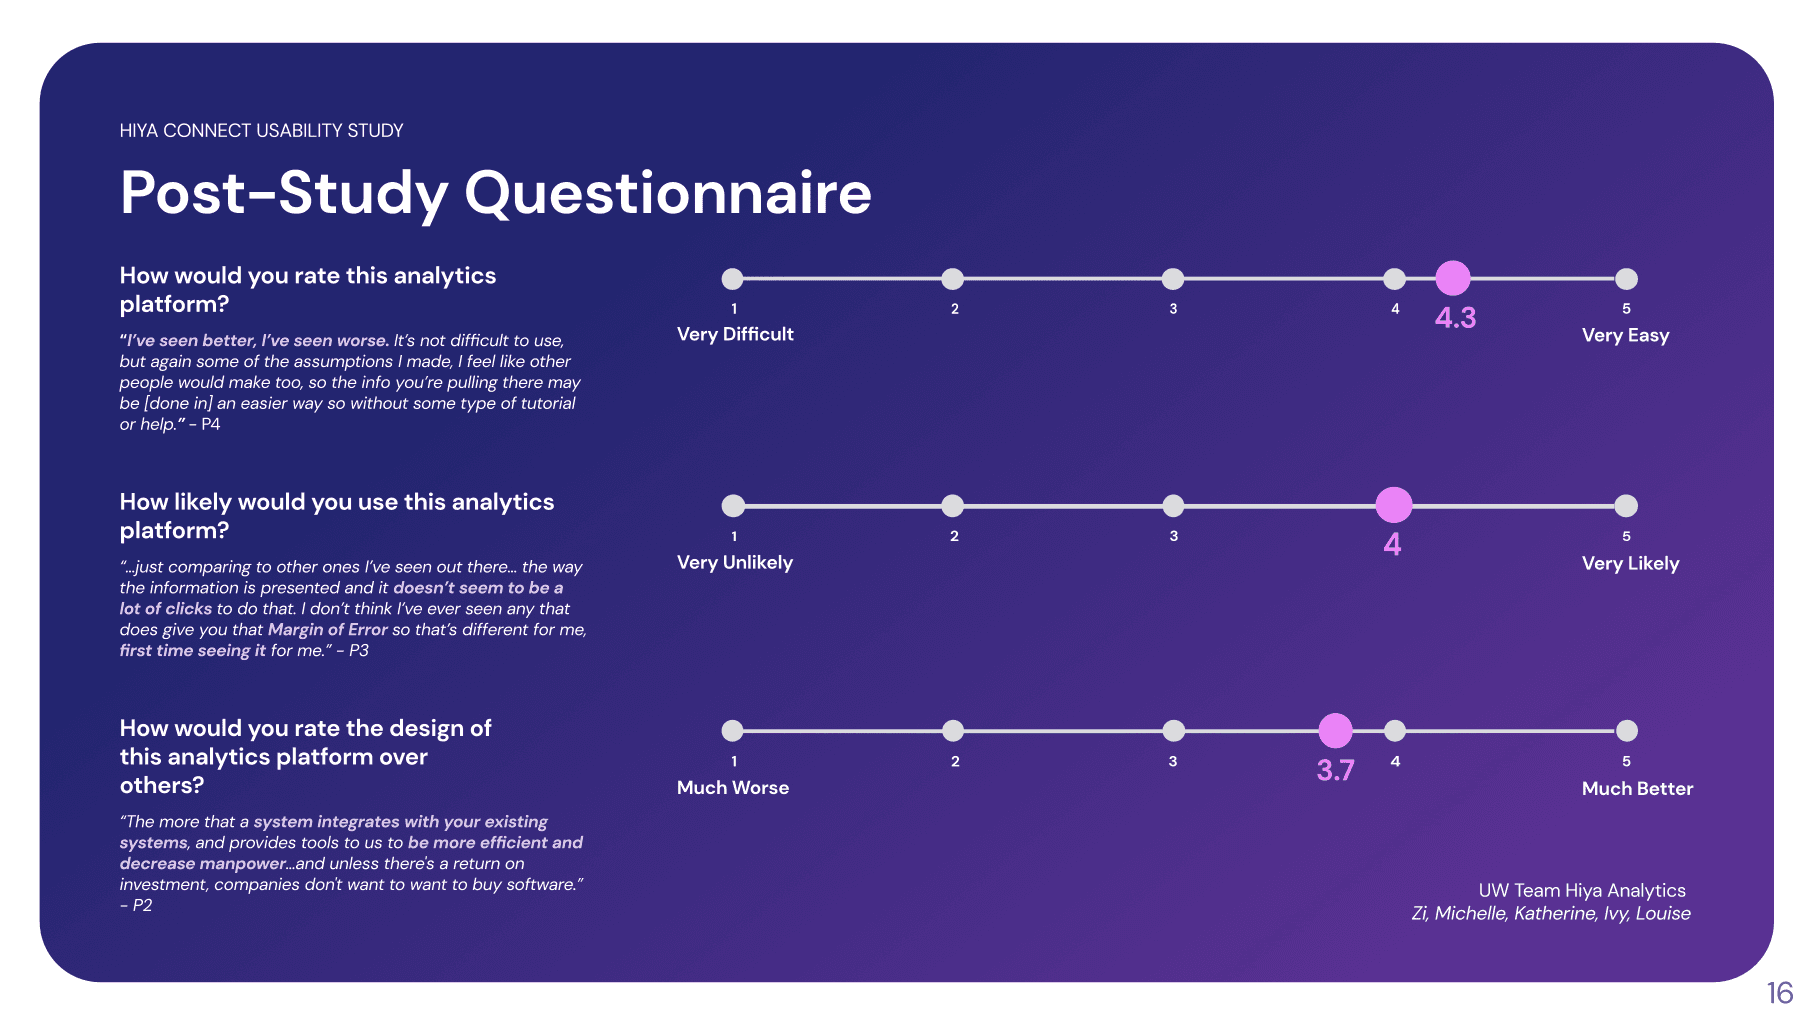
Likert Scale Results
Platform Usability Impressions
“I’ve seen better, I’ve seen worse. It’s not difficult to use, but again some of the assumptions I made, I feel like other people would make too, so the info you’re pulling there may be [done in] an easier way so without some type of tutorial or help.” P4
Very Difficult
Very Easy
Adoption Likelihood
“...just comparing to other ones I’ve seen out there… the way the information is presented and it doesn’t seem to be a lot of clicks to do that. I don’t think I’ve ever seen any that does give you that Margin of Error so that’s different for me, first time seeing it for me.” P3
Very Likely
Very Unlikely
User Interface Impressions
“The more that a system integrates with your existing systems, and provides tools to us to be more efficient and decrease manpower...and unless there's a return on investment, companies don't want to want to buy software.” P2
Much Worse
Much Better
Impact
Implementing Design Recommendations
Our usability report drove immediate change. Within weeks, Hiya Connect unveiled updates to their dashboard interface, directly incorporating our design recommendations, underscoring the impact and value of our findings.
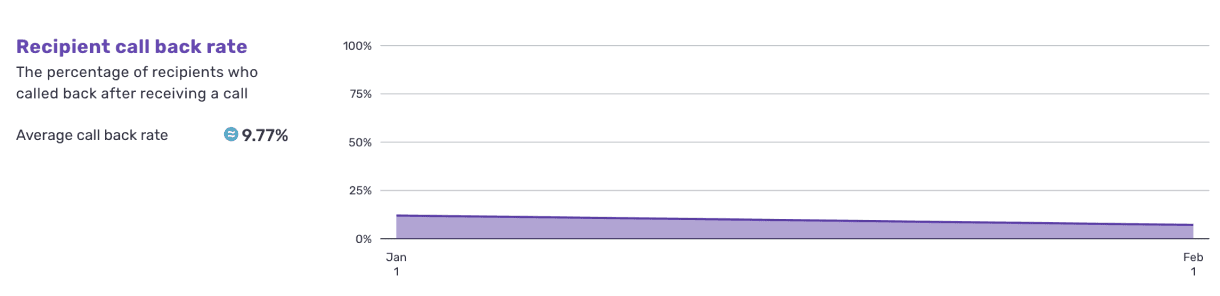
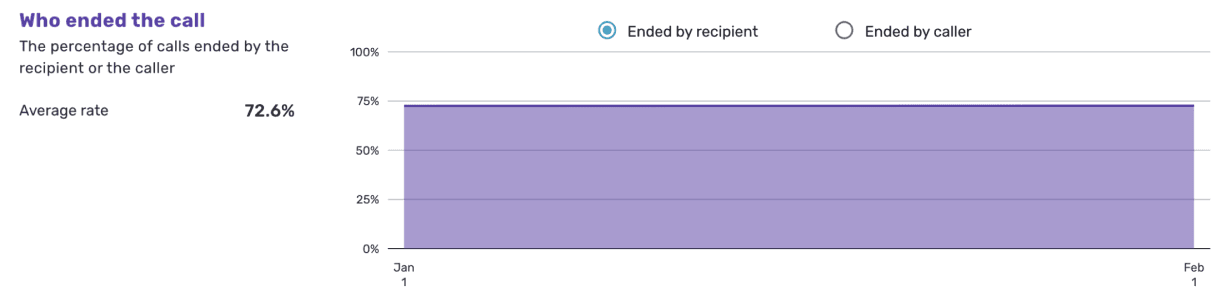
2 Additional Graphs
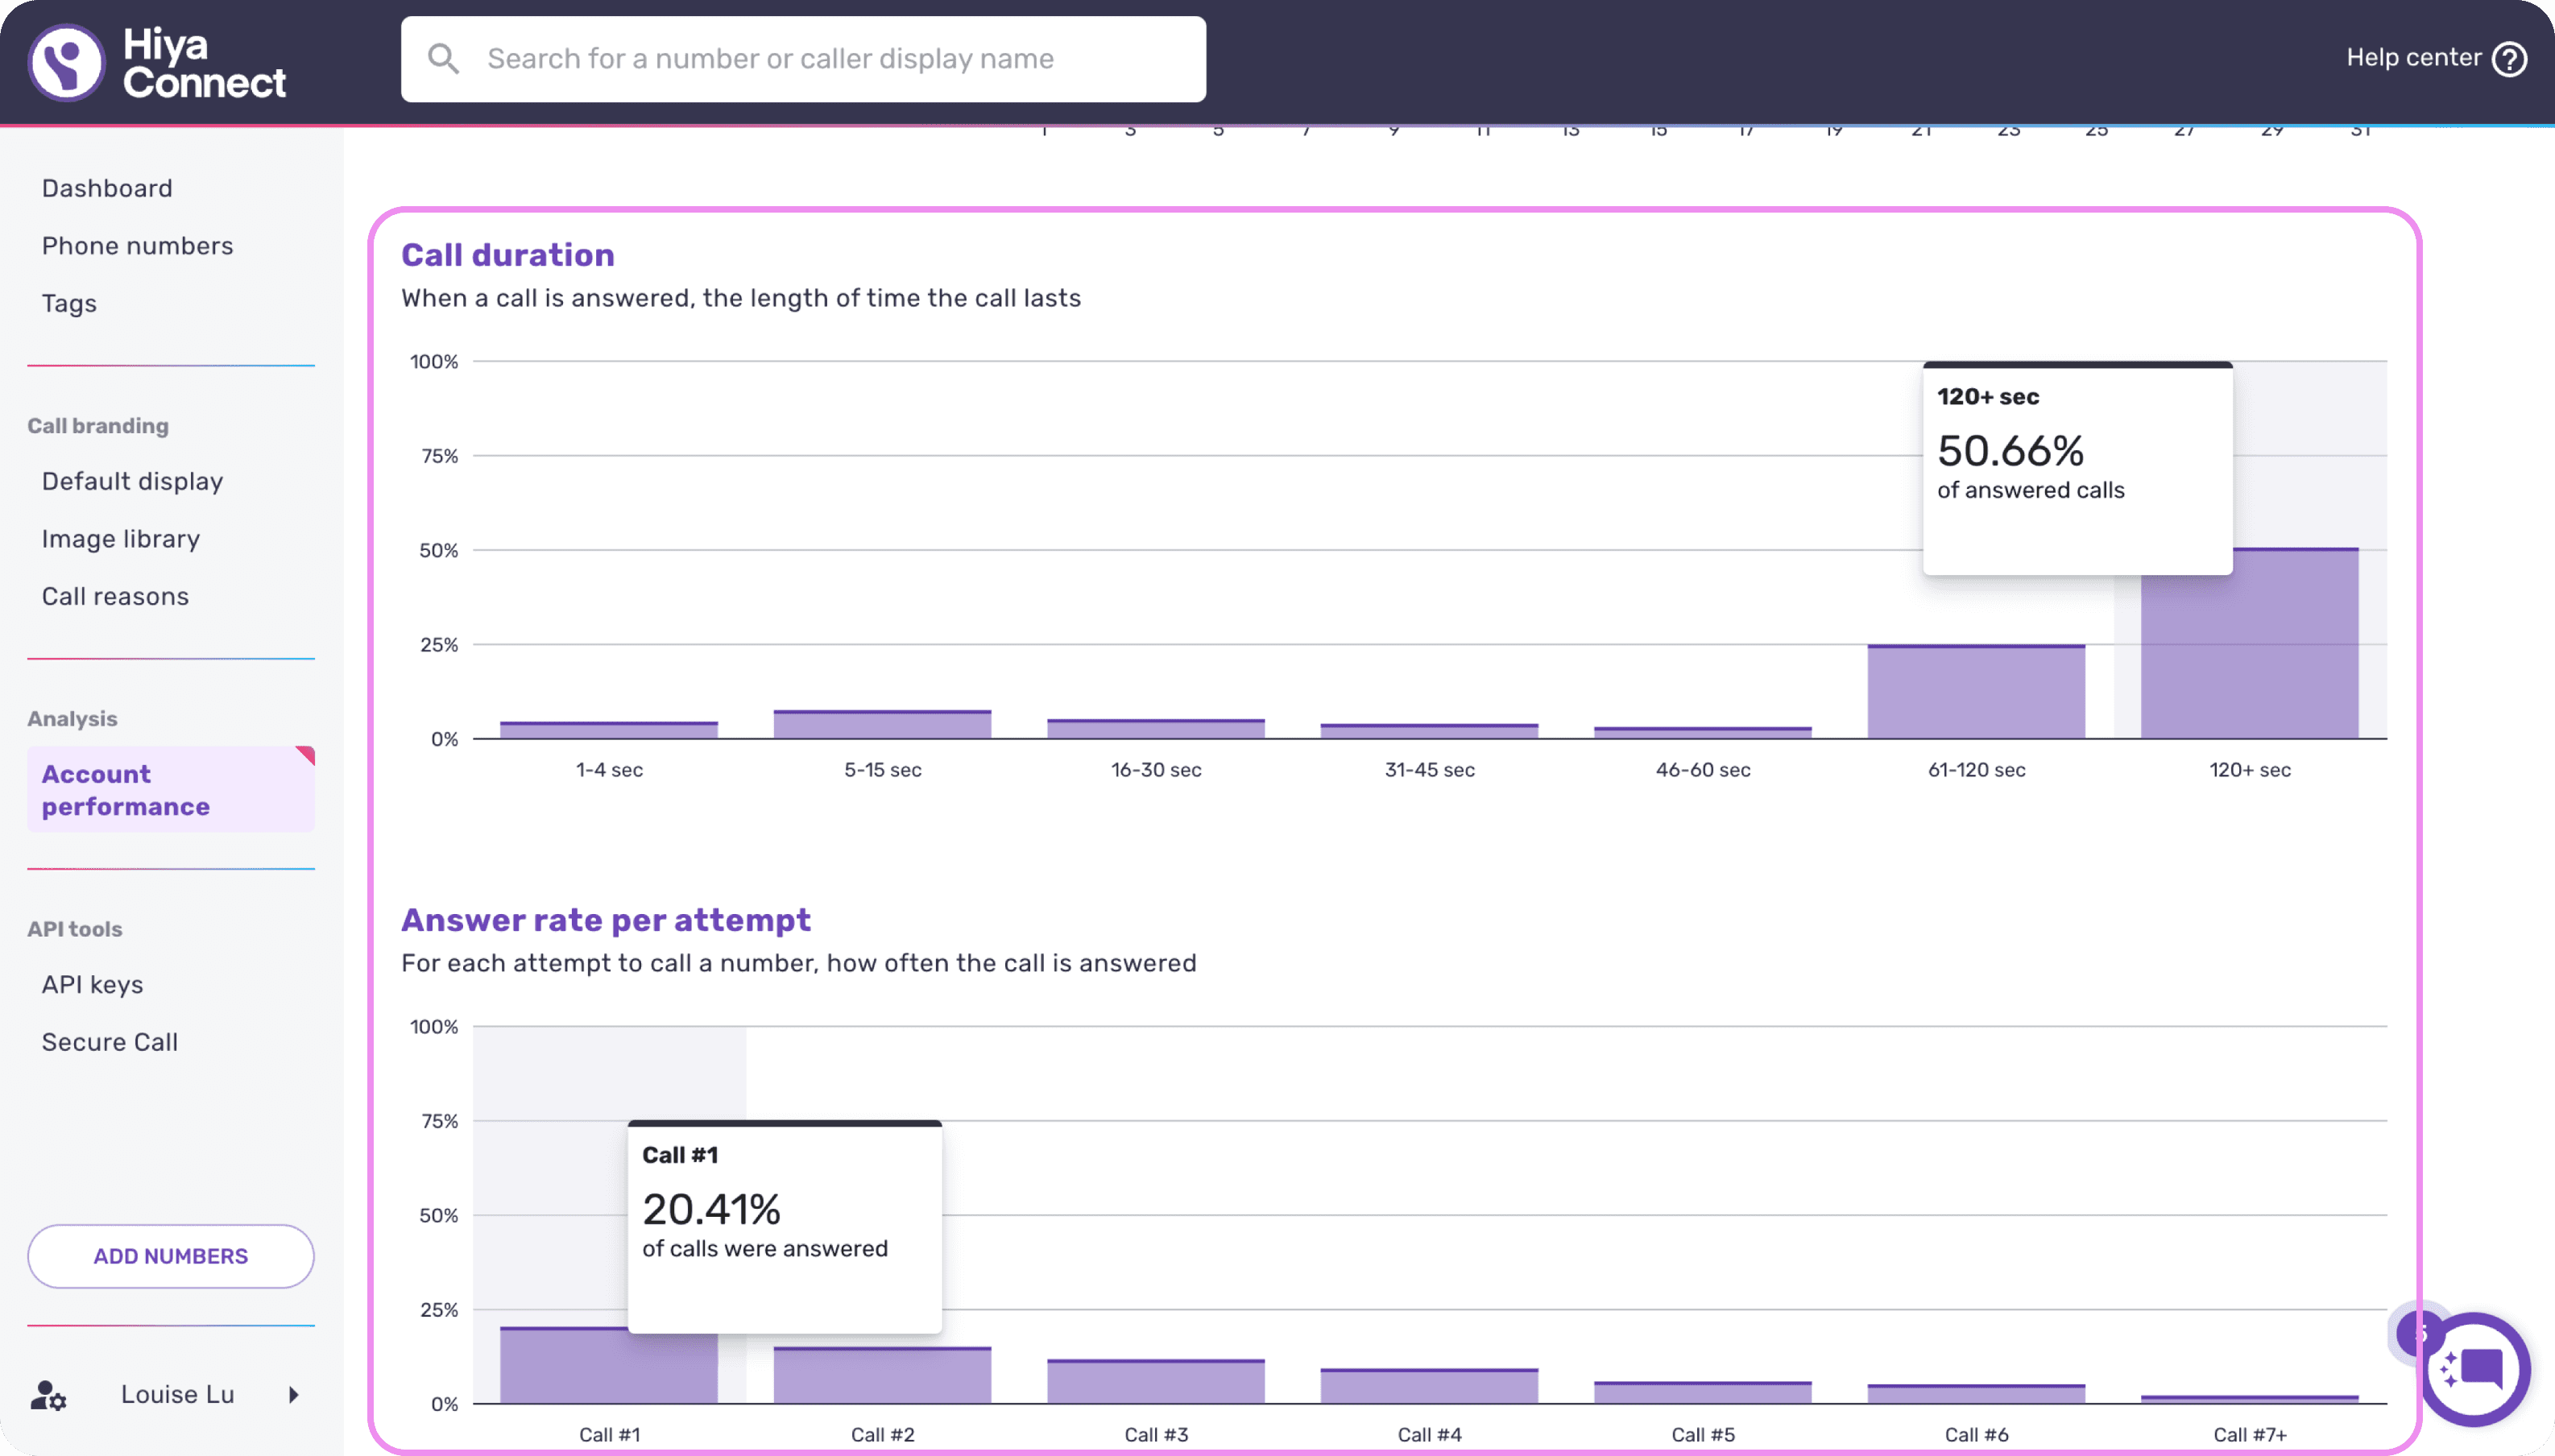
Finding: Participants desired more detailed and customized graph analytics, seeking to expand basic data like call duration into richer insights, such as who ended each call.
Recommendation: Create new graphs with enhanced data functionality to provide more granula call insights.
Before

After
Working with Hiya Inc.’s Principal Product Designer, we helped introduce 2 new, specialized graphs that display call termination data with custom features that allow users to toggle their data views, allowing call center employees to contextualize their call duration data with call termination information.

New Graph 01:
Call Ended by Recipient
Data Customization Toggle

New Graph 02:
Call Ended by Caller
Stakeholder Feedback
I served as a lead presenter for our executive presentation of our usability report findings, which sparked strategic discussions among Hiya Inc.'s Senior Product and Research teams.
Sr. UX Researcher at Hiya Inc:
"We've been able to apply [your] recommendations almost immediately, and many insights were only discoverable because of [your] unique experiences and fresh perspectives"
UX Research Consultant
“This is a fantastic report, honestly. I love the amount of detail you’ve packed in there.”
Reflection
Key Takeaways
Our Usability Study report included step-by-step scripts, decision point explanations, and a thorough recommendation report with visual aids. This approach enabled easy future replication by researchers and designers, as well as improved understanding of the purpose and impact of each recommendation for product managers and engineers.
In future projects, I will prioritize thorough pilot testing for all user interactions. This approach will help identify and resolve issues early, ensuring smoother execution and more effective questioning during real testing or client presentations.